Reader small image

You're reading from  Learning Tableau 2019 - Third Edition

Product typeBook
Published inMar 2019
PublisherPackt
ISBN-139781788839525
Edition3rd Edition
Tools
Right arrow
Author (1)
Joshua N. Milligan
Joshua N. Milligan
author image
Joshua N. Milligan

Joshua N. Milligan is a Hall of Fame Tableau Zen Master and 2017 Iron Viz Global finalist. His passion is training, mentoring, and helping people gain insights and make decisions based on their data through data visualization using Tableau and data cleaning and structuring using Tableau Prep. He is a principal consultant at Teknion Data Solutions, where he has served clients in numerous industries since 2004.
Read more about Joshua N. Milligan

Right arrow

Diving Deep with Table Calculations

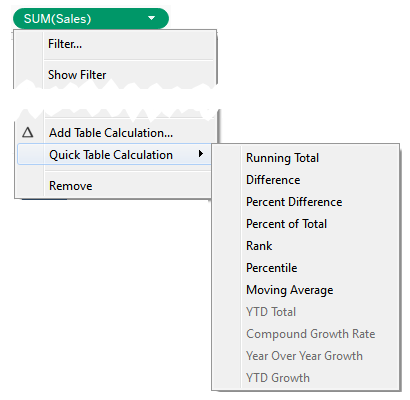
Table Calculations are one of the most powerful features in Tableau. They enable solutions that really couldn't be achieved any other way (short of writing a custom application or complex custom SQL scripts!). The features include the following:

  • They make it possible to use data that isn't structured well and still get quick results without waiting for someone to fix the data at the source
  • They make it possible to compare and perform calculations on aggregate values across rows of the resulting table
  • They open incredible possibilities for analysis and creative approaches to solving problems, highlighting insights, or improving the user experience

Table Calculations range in complexity from incredibly easy to create (a couple of clicks) to extremely complex (requiring an understanding of addressing, partitioning, and data densification...

An overview of Table Calculations

Table Calculations are different from all other calculations in Tableau. Row-level, aggregate calculations, and LOD expressions, which we considered in the previous chapter, are performed as part of the query to the data source. If you were to examine the queries sent to the data source by Tableau, you'd find the code for your calculations translated into whatever flavor of SQL the data source used.

Table Calculations, on the other hand, are performed after the initial query. Here's an extended diagram that shows how aggregated results are stored in Tableau's cache:

Table Calculations are performed on the aggregate table of data in Tableau's cache right before the data visualization is rendered. As we'll see, this is important to understand for multiple reasons, including the following:

  • Aggregation: Table Calculations...

Quick Table Calculations

Quick Table Calculations are predefined Table Calculations that can be applied to any field used as a measure in the view. These calculations include common and useful calculations such as running total, difference, percent difference, percent of total, rank, percentile, moving average, YTD total, compound growth rate, Year over Year Growth, and YTD growth. You'll find applicable options on the drop-down list on a field used as a measure in the view, as shown in the following screenshot:

Consider the following example using the sample Superstore Sales data:

Here, Sales over time are shown. Sales has been placed on the Rows shelf twice and the second SUM(Sales) field has had the Running Total Quick Table Calculation applied. Using the Quick Table Calculation avoided writing any code.

You can actually see the code that the Quick Table Calculations...

Relative versus fixed

We'll take a look at some of the options for Table Calculations shortly. Based on the options, you can compute Table Calculations in one of the two following ways:

  • Relative: The Table Calculation will be computed relative to the layout of the table. They might move across or down the table. Rearranging dimensions in a way that changes the table will change the Table Calculation results. As we'll see, the key for relative Table Calculations is scope and direction. When you set a Table Calculation to use a relative computation, it will continue to use the same relative scope and direction, even if you rearrange the view.
  • Fixed: The Table Calculation will be computed using one or more dimensions. Rearranging those dimensions will not change the computation of the Table Calculation. Here the scope and direction remain fixed to one or more dimensions...

Custom Table Calculations

Before we move on to some practical examples, let's briefly consider how you can write your own Table Calculations, instead of using Quick Table Calculations. You can see a list of available Table Calculation functions by creating a new calculation and selecting Table Calculation from the drop-down list under Functions.

For each of the examples, we'll set Compute Using | Category. This means Department will be the partition.

You can think of Table Calculations broken down into several categories. The following Table Calculations can be combined and even nested just like other functions.

Meta table functions

These are the functions that give you information about the partitioning and addressing...

Practical examples

Having looked at some of the essential concepts of Table Calculations, let's consider some practical examples. We'll look at several examples, although the practical use of Table Calculations is nearly endless. You are able to do everything from running sums, analyzing year-over-year growth, viewing percentage difference between categories, and much more.

Year over Year Growth

Often, you may want to compare year over year values. How much has our customer base grown over last year? How did sales in each quarter compare to sales in the same quarter last year? These types of questions can be answered using Year over Year Growth.

Tableau exposes Year over Year Growth as one option in the Quick...

Data densification

Data densification is a broad term that indicates that missing values or records are "filled in". Sometimes, specific terms such as domain padding (filling in missing dates or bin values) or domain completion (filling in missing intersections or dimensional values) are used to specify the type of densification, but here, we'll simply use the term data densification.

Data with missing values (such as data that doesn't have a record for every single date or only contains records for products that have been ordered, as opposed to all products in inventory) is referred to as sparse data.

Understanding when Tableau uses data densification and how you can turn it on or turn it off is important as you move toward mastering Tableau. There will be times that Tableau will engage data densification when you don't want it and you'll need to...

Summary

We've covered a lot of concepts surrounding Table Calculations in this chapter. You now have a solid foundation for understanding everything, from Quick Table Calculations to advanced Table Calculations and data densification. The practical examples we covered barely scratch the surface of what is possible, but should give you an idea of what can be achieved. The kinds of problems that can be solved and the diversity of questions that can be answered are almost limitless!

We'll turn our attention to some lighter topics in the next couple of chapters, looking at formatting and design, but we'll certainly see another Table Calculation or two before we're finished!

lock icon
The rest of the chapter is locked
You have been reading a chapter from
Learning Tableau 2019 - Third Edition
Published in: Mar 2019Publisher: PacktISBN-13: 9781788839525
Register for a free Packt account to unlock a world of extra content!
A free Packt account unlocks extra newsletters, articles, discounted offers, and much more. Start advancing your knowledge today.
undefined
Unlock this book and the full library FREE for 7 days
Get unlimited access to 7000+ expert-authored eBooks and videos courses covering every tech area you can think of
Renews at $15.99/month. Cancel anytime

Author (1)

author image
Joshua N. Milligan

Joshua N. Milligan is a Hall of Fame Tableau Zen Master and 2017 Iron Viz Global finalist. His passion is training, mentoring, and helping people gain insights and make decisions based on their data through data visualization using Tableau and data cleaning and structuring using Tableau Prep. He is a principal consultant at Teknion Data Solutions, where he has served clients in numerous industries since 2004.
Read more about Joshua N. Milligan