Reader small image

You're reading from  Learning Qlik Sense??: The Official Guide Second Edition - Second Edition

Product typeBook
Published inDec 2015
Publisher
ISBN-139781785887161
Edition2nd Edition
Right arrow
Authors (4):
Christopher Ilacqua
Christopher Ilacqua
author image
Christopher Ilacqua

Dr. Christopher Ilacqua is the research director of product validation at Qlik®. He has been working with leading customers and partners in the US for more than 3 years garnering feedback on Qlik Sense. Chris has over 25 years of experience in the field of planning and business intelligence, and he has established himself as a leading expert by advising, designing, and implementing hundreds of planning and business intelligence applications. He has a doctorate in business administration, a master's degree in business administration in accounting, and a bachelor's degree in marketing. His research interests focus on big data, data governance, mobile BI, SaaS, business collaboration, and cloud-based solutions. Additionally, Chris serves as an adjunct professor at New England College of Business, where he teaches graduate students strategic leadership, marketing, operations management, and MIS.
Read more about Christopher Ilacqua

Henric Cronström
Henric Cronström
author image
Henric Cronström

Dr. Henric Cronström is vice president product and technical product advocate at Qlik, where he has worked for most of the time since the company was founded. For the first few years in Qlik's history, he was the product manager for QlikView, and then he moved into solution implementation and training. After many years in the field, including a role as a manager for the technical staff in QlikTech, Germany, he returned to Sweden as deputy manager for the development organization. In his current role, his main task is the communication of technical products on blogs, in the press, and directly with large accounts. Henric has a doctorate in elementary particle physics from Lund University.
Read more about Henric Cronström

James Richardson
James Richardson
author image
James Richardson

James Richardson is business analytics strategist at Qlik®. Prior to joining Qlik,
Read more about James Richardson

View More author details
Right arrow

Chapter 5. Authoring Engaging Applications

In the previous chapters, we looked at the application life cycle and the different roles of users: the consumer and the contributor. Having established the basic requirements, in this chapter we will dive into the details of app creation and discuss how it is done. We'll also look at best practices of visualization and how to employ them using Qlik Sense.

In this chapter, we will discuss the following topics:

  • The process of building an app

  • Data connectors

  • The data model viewer

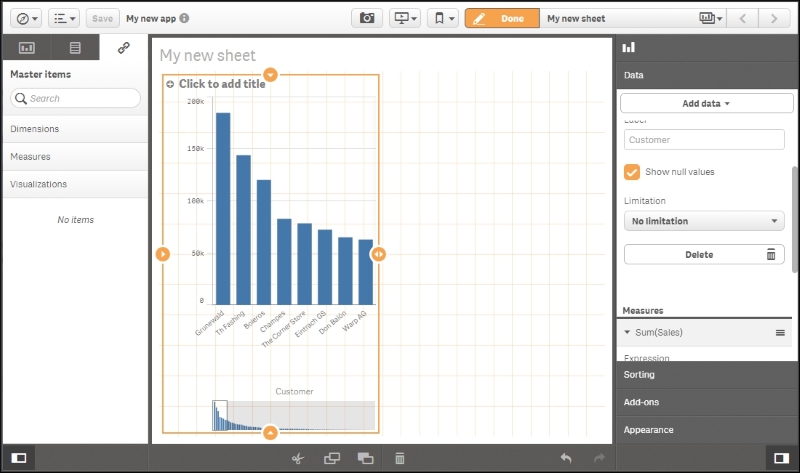
  • Sheet objects—visualizations

  • Best practices

  • Migrating QlikView applications into Qlik Sense

Preparations and requirements


Often the initial step in building an app is that you have some data that you want to analyze, but you don't necessarily know exactly what you want to look for in the data. As a business user, you can—and should—just load this data into Qlik Sense and start developing. Our experience is that the best way to develop the app is to start without first defining the requirements.

The reason is that when you load data and start to create visualizations, you learn from data. This knowledge is very important once you start defining what you want to analyze. Hence, you should first develop a basic app, then take a break and evaluate what you learned. Now is the right time to start formulating the requirements.

Another common case is the opposite situation: you know that you want to calculate a specific KPI, for example, supplier efficiency, but you don't necessarily know what data you need to be able to do this. In this case, you need to start with some research about...

Getting started with the app creation


When you first open Qlik Sense, you come to the hub. This is the place where you have an overview of all your apps. The hubs look slightly different in the Desktop and Server versions, but they are essentially the same. The following screenshot shows what a hub looks like:

The Qlik Sense hub

Creating a new app

In Qlik Sense Desktop, you are greeted with a dialog that asks you to create an app as shown in the following screenshot. In the Qlik Sense server, you will find the corresponding functionality on a button labeled CREATE NEW APP in the toolbar:

The Qlik Sense Desktop welcome dialog

Creating an app means you will create an entity that will hold both the data and everything else needed to analyze it. In Qlik Sense Desktop, this is a file created in C:\Users\User\Documents\Qlik\Sense\Apps.

Loading your data


Once you have named and opened your app, you will get a screen where Qlik Sense asks you to load your data:

The Get started screen

When you have this option before you, you can load data in several different ways. The Add data command to the left will start with a wizard that helps you define what you want to load. In the background, it adds code to a script that defines the load sequence. It will, however, never show the script.

This is different from Data load editor that will take you to a script editor, where you can change the script directly.

The easiest way is to use Add data dialog to the left. This will open the Add data dialog where you can define a data source; either a database table or a file, for instance, an Excel spreadsheet.

The Add data dialog

Use Connections for folders and connections that you have previously used, and use Connect my data if it is a new data source. In this dialog, you can select your database table or browse your way to a file containing...

The analysis interface—sheets and visualizations


Once you have loaded the data into Qlik Sense, it is time to create the visualizations in the analysis user interface. A basic set of sheets and visualizations should normally be supplied by the application developer, and additional ones can be created by the users themselves.

Creating a sheet

When you have loaded the data, Qlik Sense will usually create the sheet for you, and take you there. So, if you see a big blank area with the text The sheet is empty, you can skip to the next section:

But if you are still in the Load editor, you may need to perform the following steps to create a sheet:

  1. Go to App overview using the command in the top-left menu as shown in the next picture:

    The App overview command

  2. In App overview, you can create your first sheet by clicking on the sheet placeholder to the left, or on the button to the right:

    The Create new sheet button

  3. Name it and hit Enter. You have now created an empty sheet and need to put some visualizations...

The application library


As previously mentioned, the Assets panel can show object types and fields. However, it has a third tab for predefined library entities. If you click on this tab, you will see the application library:

The library contains entities that have been predefined and that can simplify the Qlik Sense usage for a business user. Dimensions, measures, or entire visualizations can be stored in the library.

You do not need to use the library—nothing has to be predefined for Qlik Sense to work. However, if you want to reuse formulas or you have a situation where your task is to deliver an app to a business user, it is a good idea to use the library.

Which fields should be exposed?

Often, you have many fields in an app, of which maybe only a few should be exposed as dimensions. Then, you should use the library to define the fields that are appropriate as dimensions, and name them in a way that they can be easily understood.

A dimension can also be a group of fields that is exposed as...

Best practices in data visualization


In the new world of ever increasing data volumes, the ability to visually communicate insights from data is an important skill set. Both the structure of an app and the chosen visualizations affect how data is perceived.

An app can contain many sheets, and the order of the sheets and what you put in them is the first consideration. The best practices can be summarized in three words: dashboard, analysis, and report (DAR).

Dashboard

The dashboard is where the high-level perception takes place. It is usually the first sheet or the landing page, and it should give just the most important information and have the least amount of interactivity. Its main purpose is to help users get an overview and scan for status changes. The users can see at a glance whether things are working or not. It's a starting point, such as a table of contents; the user gets an idea of what is available and then heads off to other parts of the app based on what they have seen.

Some advice...

Migrating applications from QlikView® to Qlik Sense®


All QlikView applications since QlikView Version 8 can easily be migrated. However, the conversion is only partial. The data and the script will be converted, but nothing from the layout is used. Perform the following steps to migrate applications:

  1. Move the QlikView app—the .qvw file—to your Qlik Sense Desktop app folder at C:\Users\<user>\Documents\Qlik\Sense\Apps. The file will then appear in your Desktop hub as a legacy app. Its name will have (qvw) after it:

  2. You can now open the app and see the data model and the existing script.

  3. Once you make changes, you will need to save these. This is when the conversion takes place. The old app with the new changes will be saved into a file with extension .qvf, and the old .qvw file will be renamed to *.qvw.backup.

Changes to the script

You might also need to make changes to the script. The structure of the script can remain the same, but all references to databases and files should be changed...

Publishing your apps


When you have created an app, the next step is to make it available for other users. Perform the following steps if you have developed your app using Qlik Sense Desktop:

  1. Import the app using the Apps sheet in the Qlik Sense Management Console. There, you will find an Import button at the bottom:

  2. Once the file is imported, you may also need to assign the correct owner: mark the file, click on Edit, and change the owner, if necessary. The file will then appear under My Work in the Qlik Sense hub.

    Note

    If you have developed the app using the Server version, it will already be under My Work.

  3. Before you publish the app, it is recommended that you make a copy of the file. Mark the file on the Apps page in the Qlik Sense Management Console and select Duplicate in the More actions menu.

  4. Now, you are ready to publish. You can publish the app by marking the file and clicking on the Publish button.

  5. Publishing means that you move an app from your personal workspace to a stream, which means...

Summary


In this chapter, we looked at the functions and commands you need to know to build engaging applications—both from a process perspective and, more practically, what you need to do to load the data and create an inviting user interface.

In the next chapter, we'll move into the basics of data modeling, which is an area you need to master in order to make advanced applications with multiple source tables.

lock icon
The rest of the chapter is locked
You have been reading a chapter from
Learning Qlik Sense??: The Official Guide Second Edition - Second Edition
Published in: Dec 2015Publisher: ISBN-13: 9781785887161
Register for a free Packt account to unlock a world of extra content!
A free Packt account unlocks extra newsletters, articles, discounted offers, and much more. Start advancing your knowledge today.
undefined
Unlock this book and the full library FREE for 7 days
Get unlimited access to 7000+ expert-authored eBooks and videos courses covering every tech area you can think of
Renews at $15.99/month. Cancel anytime

Authors (4)

author image
Christopher Ilacqua

Dr. Christopher Ilacqua is the research director of product validation at Qlik®. He has been working with leading customers and partners in the US for more than 3 years garnering feedback on Qlik Sense. Chris has over 25 years of experience in the field of planning and business intelligence, and he has established himself as a leading expert by advising, designing, and implementing hundreds of planning and business intelligence applications. He has a doctorate in business administration, a master's degree in business administration in accounting, and a bachelor's degree in marketing. His research interests focus on big data, data governance, mobile BI, SaaS, business collaboration, and cloud-based solutions. Additionally, Chris serves as an adjunct professor at New England College of Business, where he teaches graduate students strategic leadership, marketing, operations management, and MIS.
Read more about Christopher Ilacqua

author image
Henric Cronström

Dr. Henric Cronström is vice president product and technical product advocate at Qlik, where he has worked for most of the time since the company was founded. For the first few years in Qlik's history, he was the product manager for QlikView, and then he moved into solution implementation and training. After many years in the field, including a role as a manager for the technical staff in QlikTech, Germany, he returned to Sweden as deputy manager for the development organization. In his current role, his main task is the communication of technical products on blogs, in the press, and directly with large accounts. Henric has a doctorate in elementary particle physics from Lund University.
Read more about Henric Cronström

author image
James Richardson

James Richardson is business analytics strategist at Qlik®. Prior to joining Qlik,
Read more about James Richardson