Reader small image

You're reading from  Learning Google BigQuery

Product typeBook
Published inDec 2017
Reading LevelBeginner
PublisherPackt
ISBN-139781787288591
Edition1st Edition
Languages
Right arrow
Authors (3):
Thirukkumaran Haridass
author image
Thirukkumaran Haridass

Thirukkumaran Haridass currently works as a lead software engineer at Builder Homesite Inc. in Austin, Texas, USA. He has over 15 years of experience in the IT industry. He has been working on the Google Cloud Platform for more than 3 years. Haridass is responsible for the big data initiatives in his organization that help the company and its customers realize the value of their data. He has played various roles in the IT industry and worked for Fortune 500 companies in various verticals, such as retail, e-commerce, banking, automotive, and presently, real estate online marketing.
Read more about Thirukkumaran Haridass

Eric Brown
Eric Brown
author image
Eric Brown

Eric Brown currently works as an analytics manager for PMG advertising in Austin, Texas. Eric has over 11 years of experience in the data analytics field. He has been working on the Google Cloud Platform for over 3 years. He oversees client web analytics implementations and implements big data integrations in both Google BigQuery and Amazon Redshift. Eric has a passion for analytics, and especially for visualization and data manipulation through open source tools such as R. He has worked in various roles in various verticals, such as web analytics service providers, media companies, real-estate online marketing, and advertising.
Read more about Eric Brown

View More author details
Right arrow

The danger of summary statistics

When performing analyses, most analysts will use what is called summary statistics. Summary statistics is defined as descriptive statistics that are used to summarize a larger set of observations. These types of statistics are usually used because the larger set of observations is too large to analyze efficiently. For instance, an SEO analyst might use the average click-through as a measure of performance for their SEO efforts on two separate days of analysis.

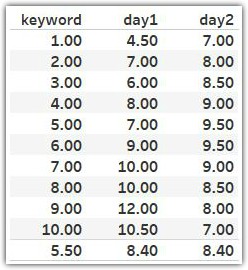
The analyst finds that the average click-through rate for both days was identical at 8.4. However, here is what is revealed when visualizing the data:

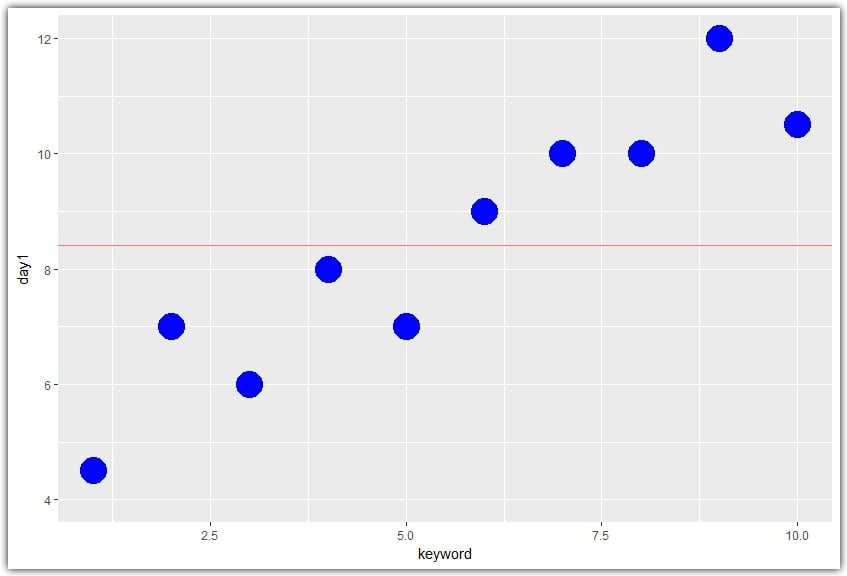
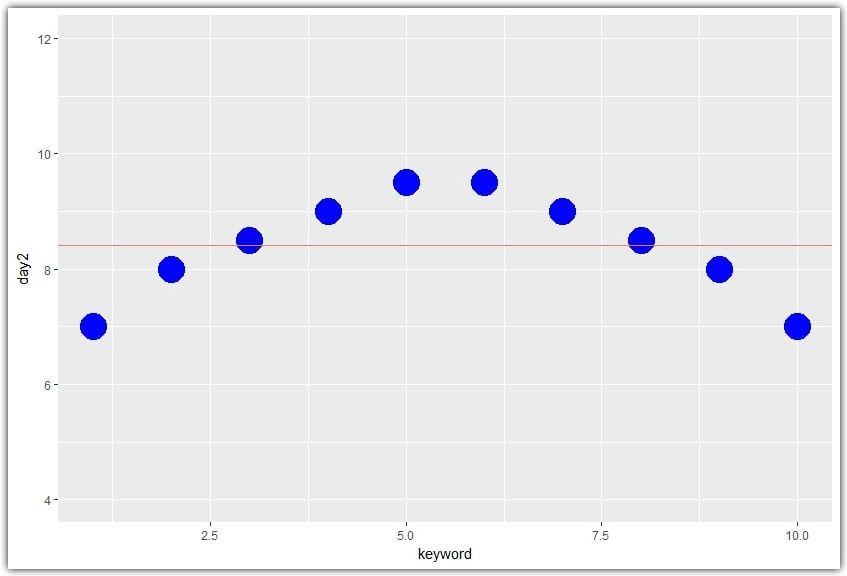
The analyst was able to see how the data was extremely different when visualized rather than just summarized.

lock icon
The rest of the page is locked
Previous PageNext Page
You have been reading a chapter from
Learning Google BigQuery
Published in: Dec 2017Publisher: PacktISBN-13: 9781787288591

Authors (3)

author image
Thirukkumaran Haridass

Thirukkumaran Haridass currently works as a lead software engineer at Builder Homesite Inc. in Austin, Texas, USA. He has over 15 years of experience in the IT industry. He has been working on the Google Cloud Platform for more than 3 years. Haridass is responsible for the big data initiatives in his organization that help the company and its customers realize the value of their data. He has played various roles in the IT industry and worked for Fortune 500 companies in various verticals, such as retail, e-commerce, banking, automotive, and presently, real estate online marketing.
Read more about Thirukkumaran Haridass

author image
Eric Brown

Eric Brown currently works as an analytics manager for PMG advertising in Austin, Texas. Eric has over 11 years of experience in the data analytics field. He has been working on the Google Cloud Platform for over 3 years. He oversees client web analytics implementations and implements big data integrations in both Google BigQuery and Amazon Redshift. Eric has a passion for analytics, and especially for visualization and data manipulation through open source tools such as R. He has worked in various roles in various verticals, such as web analytics service providers, media companies, real-estate online marketing, and advertising.
Read more about Eric Brown