Reader small image

You're reading from  Data Wrangling with SQL

Product typeBook
Published inJul 2023
PublisherPackt
ISBN-139781837630028
Edition1st Edition
Right arrow
Authors (2):
Raghav Kandarpa
Raghav Kandarpa
author image
Raghav Kandarpa

Raghav Kandarpa is an experienced Data Scientist in Finance and logistics industry with expertise in SQL, Python, Building Machine Learning Models, Financial Data Modelling, and Statistical Analysis. He holds a Masters' degree in Business Analytics specializing in Data Science from the University of Texas at Dallas.
Read more about Raghav Kandarpa

Shivangi Saxena
Shivangi Saxena
author image
Shivangi Saxena

Shivangi Saxena is an experienced BI Engineer with proficiency in SQL, Data Visualization, and Statistical Analysis. She holds a master's degree in Information Technology and Management from the University of Texas at Dallas. She has several years of experience building several BI tools and products using SQL and BI reporting tools which has helped stakeholders to get visibility to the right data points
Read more about Shivangi Saxena

View More author details
Right arrow

Time Series with SQL

A time series is a series of data points indexed in time order. Most commonly, a time series is a sequence taken at successive equally spaced points in time. Thus, it is a sequence of discrete-time data. Time series data is a sequence of data points. Each of the data points includes a timestamp. Timestamps usually include a date and then a time. Time series analysis comprises methods for analyzing time series data in order to extract meaningful statistics and other characteristics of the data. Time series forecasting is the use of a model to predict future values based on previously observed values. While regression analysis is often employed in such a way as to test relationships between one or more different time series, this type of analysis is not usually called “time series analysis,” which refers to relationships between different points in time within a single series.

Figure 12.1 – Time series using SQL

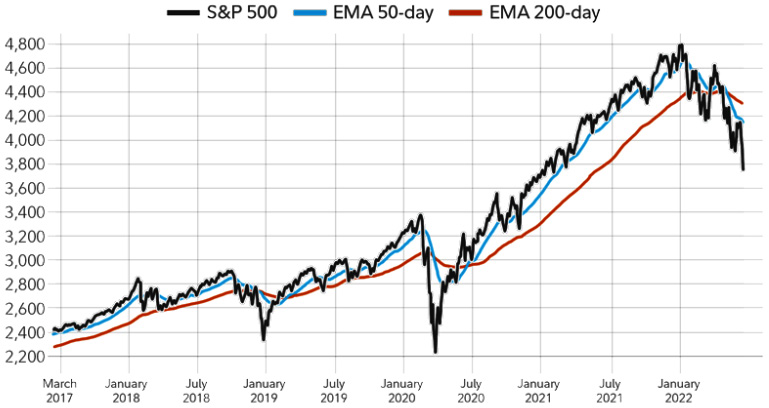
Figure 12.1 – Time series using SQL...

Running totals

Running totals, also known as cumulative totals, are a way of keeping track of a running sum of values as new data is added. In other words, it is a calculation that shows the total of a set of values up to a certain point in time. For example, let’s say you have a table of daily sales for a store. You can use a running total to calculate the total sales up to each day of the week. This means that for Monday, the running total would be the total sales for Monday, and for Tuesday, the running total would be the total sales for Monday and Tuesday. The running-total calculation adds up the sales for each day and displays the total up to the current day. It’s a useful tool for analyzing data over time and understanding trends.

In SQL, you can use a window function to calculate running totals. A window function allows you to perform calculations over a subset of rows, including running totals. By using the SUM function and the OVER clause in SQL, you can...

Lead and lag for time series analysis

As we have already read in the previous chapters, LEAD and LAG functions are used to refer to the previous or next row in the dataset for a specific column. Let’s start understanding this with an example.

Case scenario

Imagine you have a table that tracks the number of sales made by a company each month, as follows:

...

Percentage change

Calculating percentage change over time is an important analysis technique in time series analysis because it allows us to track the growth rate of a variable (such as sales, revenue, or profit) over time. By calculating the percentage change from one time period to another, we can identify trends, patterns, and anomalies in the data. For example, if we see a consistent positive percentage change in sales over time, we can conclude that our business is growing. On the other hand, if we see a consistent negative percent change, we may need to adjust our business strategies or identify potential issues affecting our sales. Moreover, calculating percentage change allows us to compare the relative change between two time periods, regardless of the absolute level of the variable being measured. This makes it easier to compare and analyze trends across different time periods, which is especially useful for identifying seasonality or cyclical patterns in the data. Overall...

Moving averages

A moving average is a time series analysis technique that is commonly used to smooth out fluctuations in the data and identify trends or patterns. In SQL, a moving average can be calculated using a window function. A moving average is the average of a fixed number of the most recent data points in a time series. For example, a 3-month moving average for monthly sales data would be the average of the most recent 3 months of sales data. As new data becomes available, the moving average “moves” forward, with the oldest data point being dropped from the calculation and the newest data point being added. A moving average is important because it helps to remove noise or fluctuations in the data and provides a clearer view of underlying trends or patterns. This is especially useful in identifying seasonal or cyclical patterns, as well as longer-term trends in the data. Moreover, moving averages can also help to identify turning points or changes in the direction...

Rank for time series analysis

A rank is a measure used in time series analysis to determine the relative position of a data point within a set of historical observations. In other words, it helps you understand how a particular data point compares to other data points in terms of its magnitude or value.

Case scenario

For example, if you have a time series of daily temperature readings over the course of a month, you might use a rank to determine whether a particular day’s temperature was unusually high or low compared to the rest of the month.

To calculate the rank, you would simply order all of the data points in your time series from lowest to highest (or vice versa) and assign each point a rank based on its position in the ordering. The highest value would receive a rank of 1, the second-highest a rank of 2, and so on.

Once you have calculated the rank for a particular data point, you can compare it to the ranks of other data points to gain insights into how it...

CTE for time series analysis

A common table expression (CTE) is a temporary named result set in SQL that you can use to perform complex queries. In time series analysis, CTEs can be used to create a rolling window of data that you can use to calculate metrics such as moving averages, percentiles, and other statistical measures.

Here is an example of how you could use a CTE in SQL to calculate a rolling average of temperature readings over a 7-day period:

WITH rolling_average AS (  SELECT day, temperature,
         AVG(temperature) OVER (ORDER BY day ROWS BETWEEN 6 PRECEDING AND CURRENT ROW) AS rolling_avg
  FROM temperature_data
)
SELECT day, temperature, rolling_avg
FROM rolling_average;

In this example, we first create a CTE called rolling_average that includes the day, temperature, and a rolling average calculated using the AVG function and a window that includes the current row and the six preceding rows...

Forecasting with linear regression

Forecasting with linear regression in SQL is useful because it allows us to make predictions about future values based on historical data and other relevant factors. By using SQL to build and analyze these models, we can gain insights into how different factors affect our business and make more informed decisions about how to allocate resources and plan for the future.

Some of the benefits of using linear regression for forecasting in SQL include the following:

  • Simplicity: Linear regression is a simple and widely used technique for predicting future values. By using SQL to build and analyze these models, we can easily incorporate data from different sources and perform calculations that might be difficult or time-consuming in other software.
  • Flexibility: Linear regression can be used to predict a wide range of values, including sales, website traffic, customer engagement, and more. By using SQL to build and analyze these models, we...

Summary

This brings us to the end of this chapter, where we have learned about how to use SQL to analyze time series data and make predictions about future values based on historical trends and other relevant factors. Specifically, you learned the following:

  • How to use SQL to aggregate and visualize time series data, including techniques such as grouping by time intervals, calculating moving averages, and creating line charts and other visualizations
  • How to use common time series analysis techniques in SQL, such as calculating seasonality, trend, and volatility, and using CTEs to analyze data over time
  • How to use SQL to build and analyze forecasting models, including linear regression models
  • How to use SQL to generate KPIs related to time series data, such as forecast accuracy, sales forecasting, customer engagement forecasting, and inventory forecasting

In the next chapter, we will learn different methods to find outliers in the data easily. Outlier detection is an important aspect of data analysis as it helps determine if the data is correct, looks at the skewness of the data, and removes any unexpected values.

lock icon
The rest of the chapter is locked
You have been reading a chapter from
Data Wrangling with SQL
Published in: Jul 2023Publisher: PacktISBN-13: 9781837630028
Register for a free Packt account to unlock a world of extra content!
A free Packt account unlocks extra newsletters, articles, discounted offers, and much more. Start advancing your knowledge today.
undefined
Unlock this book and the full library FREE for 7 days
Get unlimited access to 7000+ expert-authored eBooks and videos courses covering every tech area you can think of
Renews at $15.99/month. Cancel anytime

Authors (2)

author image
Raghav Kandarpa

Raghav Kandarpa is an experienced Data Scientist in Finance and logistics industry with expertise in SQL, Python, Building Machine Learning Models, Financial Data Modelling, and Statistical Analysis. He holds a Masters' degree in Business Analytics specializing in Data Science from the University of Texas at Dallas.
Read more about Raghav Kandarpa

author image
Shivangi Saxena

Shivangi Saxena is an experienced BI Engineer with proficiency in SQL, Data Visualization, and Statistical Analysis. She holds a master's degree in Information Technology and Management from the University of Texas at Dallas. She has several years of experience building several BI tools and products using SQL and BI reporting tools which has helped stakeholders to get visibility to the right data points
Read more about Shivangi Saxena

Month

Sales

1/1/2021

100

2/1/2021

150

3/1/2021

200

4/1/2021

250

5/1/2021

300

6/1/2021

350

7/1/2021

400

8/1/2021

450