Reader small image

You're reading from  Data Analysis with IBM SPSS Statistics

Product typeBook
Published inSep 2017
PublisherPackt
ISBN-139781787283817
Edition1st Edition
Right arrow
Authors (2):
Ken Stehlik-Barry
Ken Stehlik-Barry
author image
Ken Stehlik-Barry

Kenneth Stehlik-Barry, PhD, joined SPSS as Manager of Training in 1980 after using SPSS for his own research for several years. Working with others at SPSS, including Anthony Babinec, he developed a series of courses related to the use of SPSS and taught these courses to numerous SPSS users. He also managed the technical support and statistics groups at SPSS. Along with Norman Nie, the founder of SPSS and Jane Junn, a political scientist, he co-authored Education and Democratic Citizenship. Dr. Stehlik-Barry has used SPSS extensively to analyze data from SPSS and IBM customers to discover valuable patterns that can be used to address pertinent business issues. He received his PhD in Political Science from Northwestern University and currently teaches in the Masters of Science in Predictive Analytics program there.
Read more about Ken Stehlik-Barry

Anthony Babinec
Anthony Babinec
author image
Anthony Babinec

Anthony J. Babinec joined SPSS as a Statistician in 1978 after assisting Norman Nie, SPSS founder, in a research methods class at the University of Chicago. Anthony developed SPSS courses and trained many SPSS users. He also wrote many examples found in SPSS documentation and worked in technical support. Anthony led a business development effort to find products implementing then-emerging new technologies such as CHAID decision trees and neural networks and helped SPSS customers successfully apply them. Anthony uses SPSS in consulting engagements and teaches IBM customers how to use its advanced features. He received his BA and MA in Sociology with a specialization in Advanced Statistics from the University of Chicago and teaches classes at the Institute for Statistics Education. He is on the Board of Directors of the Chicago Chapter of the American Statistical Association, where he has served in different positions including President.
Read more about Anthony Babinec

View More author details
Right arrow

Accessing and Organizing Data

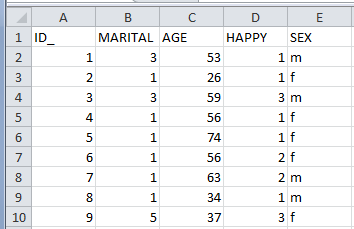
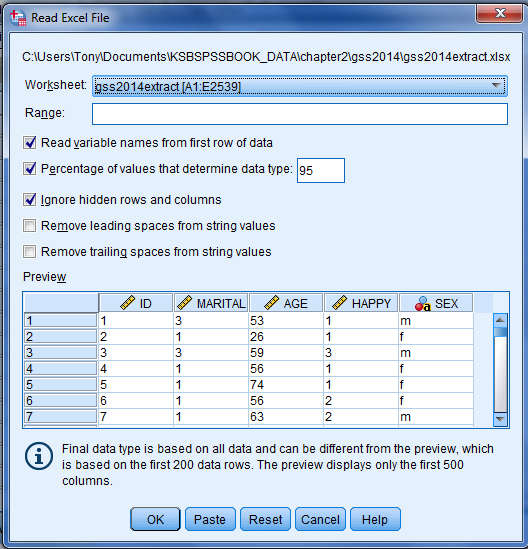
This chapter shows you how to read common file formats such as an Excel sheet or a delimited text file to IBM SPSS Statistics. The rationale for showing the reading of these formats is that most software programs read these file formats. In addition, many analysts use Excel for simple data activities such as data handling and producing charts. However, beyond these simple activities, Excel is limited in the data analytic capabilities it provides, so researchers have turned to IBM SPSS Statistics for its extensive statistical and analytical capabilities.

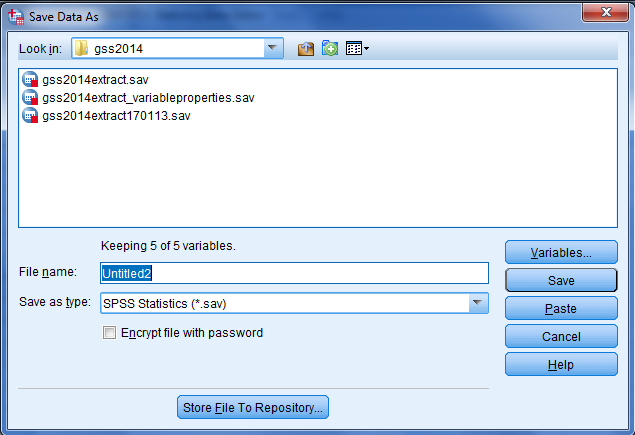
In order to use IBM SPSS Statistics, you must first read your data to the IBM SPSS Statistics Data Editor window. Once you successfully read the data, you provide variable properties to enrich the description of the data. After you have established the variable properties for the variables in your...

Accessing and organizing data overview

Once you read the data to IBM SPSS Statistics, you should at least do a cursory data check of the inputted data. Do you see numeric data? String data? Is the data in the expected scale and range? Is the data complete?

Of course, even if your data is not really very large in either the number of rows or columns, it can be difficult to assess via a simple visual inspection. For this reason, you might use SPSS Statistics to produce a tabular summary of variables showing counts and percentages. Doing so produces tables showing all the data codes in the designated variables. Once you have defined the SPSS Variable Properties such as value labels, you can control the tabular display to show data values (the data codes), value labels, or both.

A further consideration is how the data values are represented for categorical variables. Let's...

Reading Excel files

Here is a snapshot of a portion of an Excel spreadsheet:

Note that row 1 of the Excel spreadsheet is a header row containing variable names for the columns.

When working with Excel spreadsheets or delimited text files, use row 1 of the file to supply variable names that you intend to use in SPSS Statistics.

IBM SPSS Statistics can directly read an Excel sheet. There are different implementations in different recent releases of IBM SPSS Statistics but, in general, the capability exists on the File menu. In IBM SPSS Statistics 24, use the following path:

File | Import Data

Here is the Read Excel File dialog box:

By default, IBM SPSS Statistics shows the entire range of data that it encounters in the Excel sheet. You can use the Range portion of the dialog box to specify a subset range. Also by default, IBM SPSS Statistics expects to find variable names in...

Reading delimited text data files

Here is a snapshot of a portion of a comma-delimited text file:

A delimiter is a character such as a comma that serves as a separator between elements across a line of data. A text file is a kind of computer file that is structured as a sequence of lines of electronic text, often using the ASCII character set. Such a file is easily viewed in Windows accessories such as Notepad. Note that row 1 of the comma-delimited text file is a header row containing variable names for the columns.

IBM SPSS Statistics can directly read a delimited text file. There are different implementations in different recent releases of IBM SPSS Statistics, but the capability exists on the File menu. In IBM SPSS Statistics 24, use the following path:

File | Import Data

Here is the Read CSV File dialog box:

The Read CSV File dialog box shows the name of the file and a...

Saving IBM SPSS Statistics files

Use the SAVE command to save a data file in the IBM SPSS Statistics format, which contains data plus a dictionary. The dictionary contains a name for each variable, plus variable metadata (variable properties) such as assigned variable labels, value labels, missing values, and formats. As an aside, the dictionary also contains text that was specified on the DOCUMENTS command, if this command is used.

To save the data file along with variable properties from the menus, specify as follows:

File | Save

This brings up the Save Data As dialog box:

At a minimum, specify the folder in which you wish to save the file, along with a filename. Then press either Paste to paste the syntax or Save to write the file to disk. In addition, you can use the Variables… button to select variables to keep or drop.

Here is an example of the pasted syntax:

SAVE...

Reading IBM SPSS Statistics files

The IBM SPSS Statistics file is a data file created and saved in IBM SPSS Statistics. This file contains data in binary form, variable names, and other variable properties, and is directly readable by IBM SPSS Statistics.

In IBM SPSS Statistics 24, use File | Open | Data.

Here is the Open Data dialog box:

Click on OK to read the file, or click on Paste to paste the constructed syntax to the syntax window.

Here is the constructed syntax:

GET
FILE='C:\Users\Tony\Documents\KSBSPSSBOOK_DATA\chapter2\gss2014\gss2014extract170113.sav'.
DATASET NAME DataSet1 WINDOW=FRONT.

Running the syntax populates an IBM SPSS Statistics Data Editor window with the data.

Demo - first look at the data - frequencies

The GSS 2014 data extract has 2,538 rows. You can inspect the data by visually scanning and scrolling through the data window, but the sample size makes it difficult to grasp all of the data at once. For example, how many unique values are there in a given variable? Do the values in a given variable occur with about the same frequency, or do certain values predominate? Running Frequencies on the data can serve as a useful first look because it produces summary tables that show all data values on the specified variables.

To run Frequencies from the menus, specify as follows:

Analyze | Descriptive Statistics | Frequencies

This opens the Frequencies dialog box.

Move all variables except ID from the left-hand side to the right-hand side variable list. Why leave out ID? This is because the resulting frequency table is quite lengthy.

Variables...

Variable properties

Once you successfully read a source data file, the next steps are to establish the variable properties for each variable and then do some data checking.

Here is an example of a portion of a Variable View with variable properties:

The IBM SPSS Statistics Data Editor window presents two views accessible via tabs in the lower left of the window: Data View and Variable View. The Data View shows a flat file view of the data with observations in the rows and variables in the column. The Variable View shows the variables row-wise along with the variable properties. In the Variable View, there are as many rows as there are variables. At the time of writing this, there are 11 default variable properties, plus you can define and add custom attributes.

The variable properties are as follows:

  • Name: Each variable must have a unique variable name
  • Type: The type or format...

Summary

This chapter showed you how to read in data from two common file formats--Excel and delimited data. These are common file formats that are writeable by most software, so the ability to read these formats means that you can share data from many other applications.

This chapter also showed you how to save the data as an IBM SPSS Statistics data file. Of course, if you can save a file in that format, then you can use IBM SPSS Statistics to read that file format. The advantage of the SPSS Statistics file format is that the variable information and data are saved in a form that you can access directly. The SPSS Statistics file format is also the native file format of the IBM SPSS Modeler.

This chapter also discussed variable properties, which you can specify for the variables and then save in the IBM SPSS Statistics file format. Variable properties are important because they...

lock icon
The rest of the chapter is locked
You have been reading a chapter from
Data Analysis with IBM SPSS Statistics
Published in: Sep 2017Publisher: PacktISBN-13: 9781787283817
Register for a free Packt account to unlock a world of extra content!
A free Packt account unlocks extra newsletters, articles, discounted offers, and much more. Start advancing your knowledge today.
undefined
Unlock this book and the full library FREE for 7 days
Get unlimited access to 7000+ expert-authored eBooks and videos courses covering every tech area you can think of
Renews at $15.99/month. Cancel anytime

Authors (2)

author image
Ken Stehlik-Barry

Kenneth Stehlik-Barry, PhD, joined SPSS as Manager of Training in 1980 after using SPSS for his own research for several years. Working with others at SPSS, including Anthony Babinec, he developed a series of courses related to the use of SPSS and taught these courses to numerous SPSS users. He also managed the technical support and statistics groups at SPSS. Along with Norman Nie, the founder of SPSS and Jane Junn, a political scientist, he co-authored Education and Democratic Citizenship. Dr. Stehlik-Barry has used SPSS extensively to analyze data from SPSS and IBM customers to discover valuable patterns that can be used to address pertinent business issues. He received his PhD in Political Science from Northwestern University and currently teaches in the Masters of Science in Predictive Analytics program there.
Read more about Ken Stehlik-Barry

author image
Anthony Babinec

Anthony J. Babinec joined SPSS as a Statistician in 1978 after assisting Norman Nie, SPSS founder, in a research methods class at the University of Chicago. Anthony developed SPSS courses and trained many SPSS users. He also wrote many examples found in SPSS documentation and worked in technical support. Anthony led a business development effort to find products implementing then-emerging new technologies such as CHAID decision trees and neural networks and helped SPSS customers successfully apply them. Anthony uses SPSS in consulting engagements and teaches IBM customers how to use its advanced features. He received his BA and MA in Sociology with a specialization in Advanced Statistics from the University of Chicago and teaches classes at the Institute for Statistics Education. He is on the Board of Directors of the Chicago Chapter of the American Statistical Association, where he has served in different positions including President.
Read more about Anthony Babinec