Reader small image

You're reading from  Data Analysis with IBM SPSS Statistics

Product typeBook
Published inSep 2017
PublisherPackt
ISBN-139781787283817
Edition1st Edition
Right arrow
Authors (2):
Ken Stehlik-Barry
Ken Stehlik-Barry
author image
Ken Stehlik-Barry

Kenneth Stehlik-Barry, PhD, joined SPSS as Manager of Training in 1980 after using SPSS for his own research for several years. Working with others at SPSS, including Anthony Babinec, he developed a series of courses related to the use of SPSS and taught these courses to numerous SPSS users. He also managed the technical support and statistics groups at SPSS. Along with Norman Nie, the founder of SPSS and Jane Junn, a political scientist, he co-authored Education and Democratic Citizenship. Dr. Stehlik-Barry has used SPSS extensively to analyze data from SPSS and IBM customers to discover valuable patterns that can be used to address pertinent business issues. He received his PhD in Political Science from Northwestern University and currently teaches in the Masters of Science in Predictive Analytics program there.
Read more about Ken Stehlik-Barry

Anthony Babinec
Anthony Babinec
author image
Anthony Babinec

Anthony J. Babinec joined SPSS as a Statistician in 1978 after assisting Norman Nie, SPSS founder, in a research methods class at the University of Chicago. Anthony developed SPSS courses and trained many SPSS users. He also wrote many examples found in SPSS documentation and worked in technical support. Anthony led a business development effort to find products implementing then-emerging new technologies such as CHAID decision trees and neural networks and helped SPSS customers successfully apply them. Anthony uses SPSS in consulting engagements and teaches IBM customers how to use its advanced features. He received his BA and MA in Sociology with a specialization in Advanced Statistics from the University of Chicago and teaches classes at the Institute for Statistics Education. He is on the Board of Directors of the Chicago Chapter of the American Statistical Association, where he has served in different positions including President.
Read more about Anthony Babinec

View More author details
Right arrow

Installing and Configuring SPSS

If the SPSS Statistics package is not already available for you to use, you will need to start by installing the software. This section establishes the foundation to use this tool for data analysis. Even if the software is available on your computer, you will want to become familiar with setting up the environment properly in order to make the analyzing process efficient and effective.

It is also a good idea to run a basic SPSS job to verify that everything is working as it should and to see the resources that are provided by way of tutorials and sample datasets.

Before you can use IBM SPSS Statistics for data analysis, you will need to install and configure the software. Typically, an analyst or researcher will use their desktop/laptop to analyze the data and this is where the SPSS software will be installed.

When you purchase the software, or obtain it through your organization, you will receive an executable with a name such as SPSS_Statistics_24_win_64.exe. The 64 in this file name indicates that the 64-bit version of the software was selected and version 24 of SPSS is being installed.

Running this .exe file will launch the installation process but prior to this, there are some things to consider. During the installation process, you will be asked where you want the files associated with SPSS to be stored. Most often, users will put the software in the same location that they use for other applications on their machine. This is usually the C:Program Files folder.

Topics that will be covered in this chapter include the following:

  • Running the SPSS installation utility
  • Setting parameters during the installation process
  • Licensing the SPSS software
  • Setting parameters within the SPSS software
  • Executing a basic SPSS session

The SPSS installation utility

To begin the installation, double-click on the installation .exe file that you downloaded. You should see a screen similar to the one shown in the following screenshot:

Once the extraction is finished, two license-related screens will appear. Click on Next on the first screen and, after accepting the license terms (read through them first if you want), click on Next again on the second screen to continue with the installation.

Installing Python for the scripting

SPSS includes a scripting language that can be used to automate various processes within the software. While the scripting language will not be covered in this section, you may find it useful down the road.

The scripting is done via the Python language, and part of the installation process involves installing Python. The next three screens deal with installing Python and agreeing to the associated license terms. We recommend that you include Python as part of your basic software installation for SPSS. The following screenshot shows the initial screen where you indicate that the Python component is to be included in the installation:

On the two following screens, accept the license terms for Python and click on Next to proceed.

As part of the installation, you will be asked where to put the files associated with the SPSS software. By default, they will be placed in the C:\Program Files\IBM\SPSS\Statistics\24 folder, where 24 refers to the version of the SPSS software that you are installing. You can change the location for these files using the Browse button but unless you have a compelling reason to do so, we recommend using the setting shown in the image after the paragraph.

If you are concerned about having sufficient disk space on the C: drive, you can use the Available Space button to see how much free disk space is available.

Depending on the options you have licensed (SPSS consists of a base package along with options such as Advanced Statistics, Decision Trees, Forecasting, and so on), you may need up to 2 GB of disk space. After specifying the folder to use for the SPSS files, click on Next and, on the following screen, click on Install to begin the process:

The process of copying the files to the folder and performing the installation may take a couple of minutes. A screen displays the progress of the file copying step. Installing the Python component for use within SPSS results in a screen as shown in the following screenshot. There are no buttons associated with this screen, only a display of the files being compiled:

Licensing SPSS

When the screen titled InstallShield Wizard Completed appears, you can click on Finish to launch SPSS and perform the final step. SPSS uses an activation code to license the product after purchase. You should have obtained this code when you downloaded the software initially. It is typically a 20-character code with a mix of numbers and letters.

On the screen shown in the following screenshot, click on License Product to initiate the authorization of the software:

The SPSS home screen shown in the preceding screenshot contains several useful links that you may want to explore, such as the Get started with tutorials link at the bottom. If you no longer want to see this screen each time you launch SPSS, check the box at the lower left.

Use the Next button to proceed through this screen and the two following screens. The authorized user license choice on the last screen is the right choice, unless your organization has provided you with information for a concurrent user setup. If this is the case, change the setting to that option before proceeding.

The following screenshot shows the screen where you will enter your authorization code to activate the software via the Internet. While you can enter the code manually, it is easier to use copy/paste to ensure the characters are entered correctly.

Confirming the options available

The authorization code unlocks SPSS Statistics base along with any options that you are entitled to use. If your purchase included the Forecasting option, for example, there would be a Forecasting choice on the Analyze menu within the SPSS software. Some of the options included in the activation code used in this example are shown in the following screenshot:

Scroll through the license information to see which options are included in your SPSS license.

In the installation example shown here, the user purchased the Grad Pack version of SPSS, which includes a specific set of options along with the base portion of the software. The expiration date for the license just entered is displayed as well.

Launching and using SPSS

After reviewing the options that you have available, click on Finish to exit the installation process. Launch SPSS Statistics by going to the main Windows menu and finding it under Recently added in the upper left of the screen. The first screenshot shown under the licensing SPSS section is displayed initially. The tutorials included with SPSS can be accessed via the link on this screen, but they are also available via the Help menu within SPSS. Close this dialog box and the SPSS Data Editor window will be displayed.

The Data Editor window resembles a spreadsheet in terms of the layout, with the columns representing fields and the rows representing cases. As no data file has been loaded at this point, the window will have no content in the cells. Go to the Edit menu and select Options at the very bottom, as shown in the following screenshot:

Setting parameters within the SPSS software

The General tab, which is where some of the basic settings can be changed, is displayed. It is likely that you will not need to change any of these specifications initially, but at some point, you may want to alter these default settings. Click on the File Locations tab to display the dialog box in the following screenshot. Again, there is typically no need to change the settings initially, but be aware that SPSS creates temporary files during a session that are deleted when you exit the software.

If you are working with large volumes of data, you may need to direct these files to a location with more space, such as a network drive or an external device connected to your machine:

SPSS maintains a Journal file, which logs all the commands created as you move through various dialog boxes and make selections. This file provides an audit trail of sorts that can be quite useful. The file is set up to be appended and it is recommended that you keep this setting in place. As only the commands are logged in this file, it does not become very large, even over many months of using SPSS.

Executing a basic SPSS session

Click on OK to return to the Data Editor window. To confirm that the software is ready for use, go to the File menu and select Open Data. Navigate to the location where SPSS Statistics was installed, and down through the folders to the SamplesEnglish subfolder. The path shown here is typically where the sample SPSS data files that ship with the software get installed:

C:Program FilesIBMSPSSStatistics24SamplesEnglish

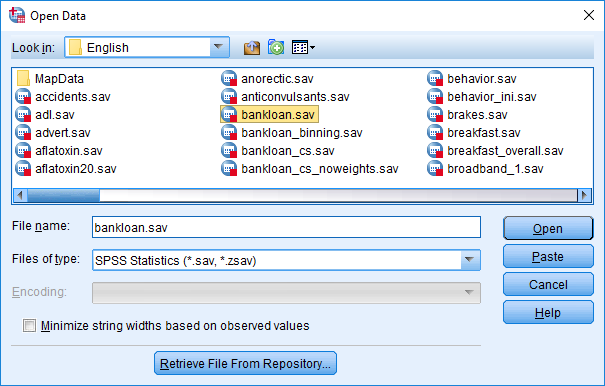
A list of sample SPSS data files (those with a .sav extension) will be displayed. For this example, select the bankloan.sav file, as shown in the following screenshot, and click on Open:

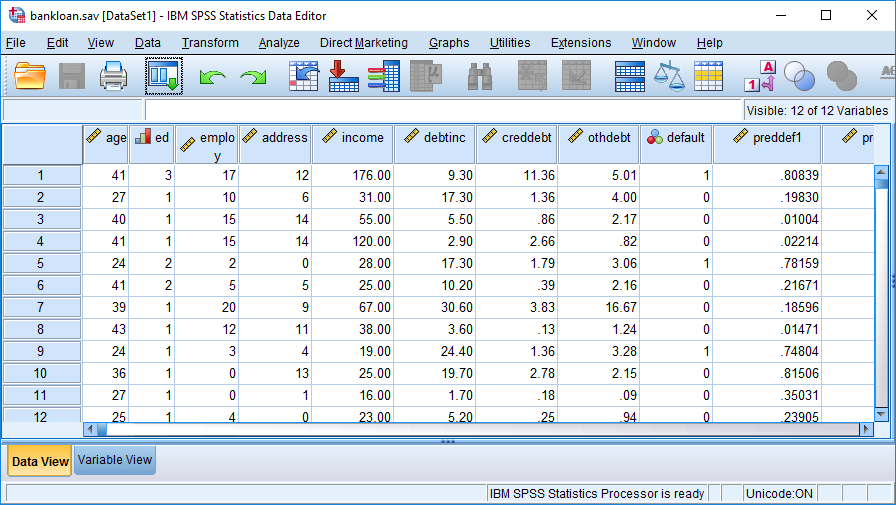
The Data Editor window now displays the name of the file just opened in the title bar with the fields (variables in SPSS terminology) as the column names and the actual values in the rows. Here, each row represents a bank customer and the columns contain their associated information. Only the first 12 rows are visible in the following screenshot, but after scrolling down, you will see more.

There are 850 rows in total:

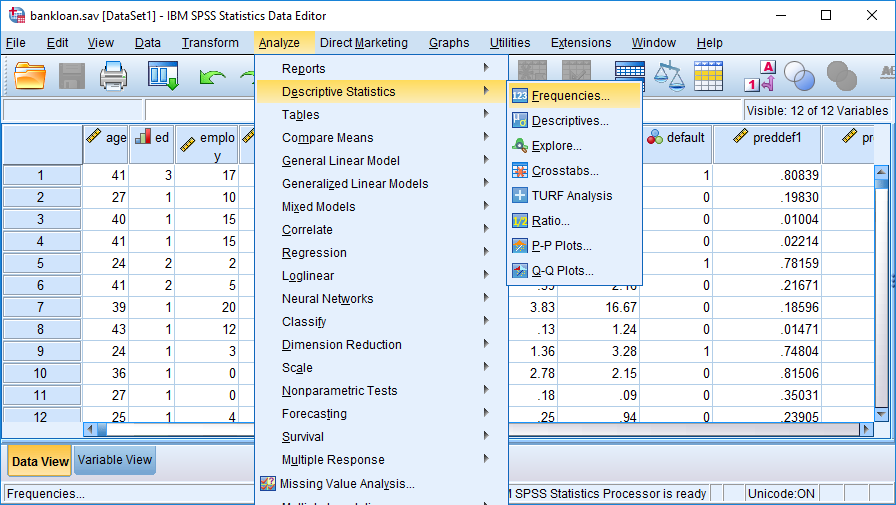
Go to the Analyze menu and select Descriptive Statistics | Frequencies, as shown in the following screenshot:


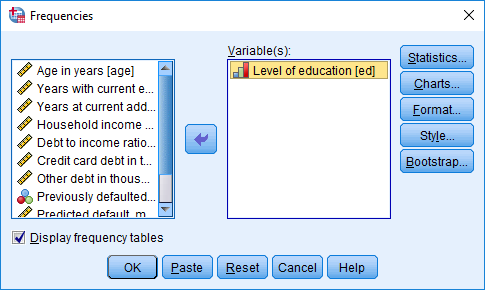
The Frequencies dialog box shown here has a Bootstrap button on the lower right. This is present because the license used for this installation included the Bootstrap option, which results in this added feature appearing in appropriate places within SPSS.

The dialog box shown in the previous image allows you to select fields and obtain basic descriptive statistics for them.

For this initial check of the software installation, select just the education field, which is shown by its label, Level of education, as shown in the following screenshot. You can double-click on the label or highlight it and use the arrow in the middle of the screen to make the selection:

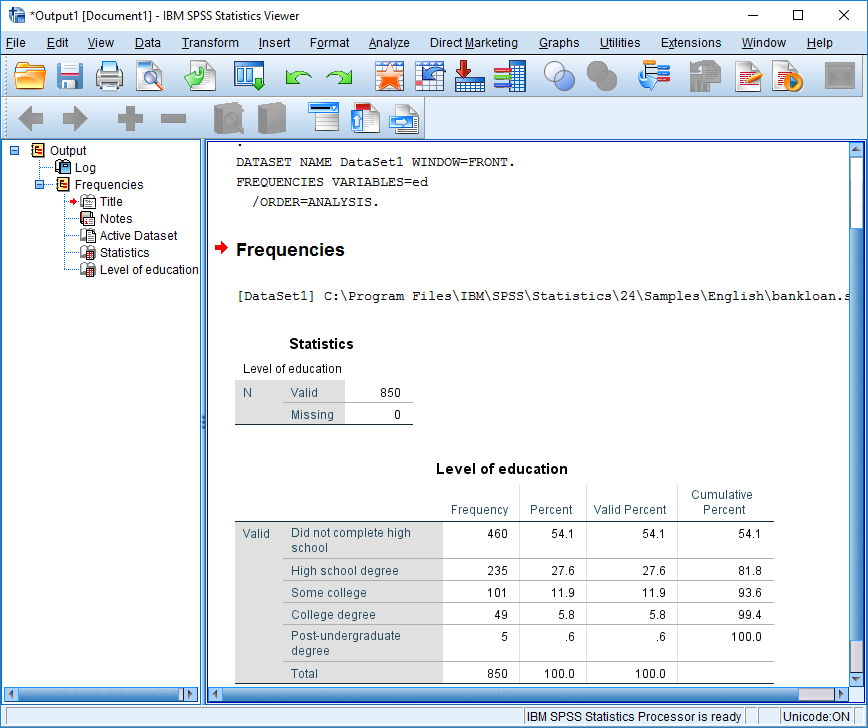
The descriptive statistics requested for the education field are presented in a new output window as shown in the following image. The left side of the output window is referred to in SPSS as the navigation pane and it lists the elements available for viewing in the main portion of the window. The frequency table for education shows that there are five levels of education present in the data for the bank's customers and that over half, 54.1%, of these 850 customers did not complete high school. This very simple example will confirm that the SPSS Statistics software is installed and ready to use on your machine.

Refer to the following image for a better understanding of descriptive statistics and the navigation pane:

To complete this check of the installation process, go to the File menu and select Exit at the bottom. You will be prompted to save the newly-created output window, which was automatically assigned the name, *Output1. There is no need to save the results of the frequency table that was created, but you can do so if you like.

The title bar of the output window shows the name *Output1, which was generated automatically by SPSS. The * indicates that the window contains material that has not been saved.

Summary

In this first chapter, we covered the basic installation of IBM SPSS Statistics on a local machine running Windows. The standard install includes the Python scripting component and requires licensing the software via the Internet. Although the default setting for things like files and display options were not modified, you saw how these elements can be changed later if there is a need to do so.

Once SPSS was up and running, the software was launched and a very basic example was covered. This should give you a sense of how to get started analyzing your own as well as confirm that everything is functioning as expected in terms of using the tool.

Congratulations! You are now ready to begin exploring the capabilities of SPSS Statistics on your data or using one if the sample data sets such as the one used in the sample session above. Be sure to take advantage of the tutorials within the Help system to facilitate the process of learning SPSS.

You have been reading a chapter from
Data Analysis with IBM SPSS Statistics
Published in: Sep 2017Publisher: PacktISBN-13: 9781787283817
Register for a free Packt account to unlock a world of extra content!
A free Packt account unlocks extra newsletters, articles, discounted offers, and much more. Start advancing your knowledge today.
undefined
Unlock this book and the full library FREE for 7 days
Get unlimited access to 7000+ expert-authored eBooks and videos courses covering every tech area you can think of
Renews at $15.99/month. Cancel anytime

Authors (2)

author image
Ken Stehlik-Barry

Kenneth Stehlik-Barry, PhD, joined SPSS as Manager of Training in 1980 after using SPSS for his own research for several years. Working with others at SPSS, including Anthony Babinec, he developed a series of courses related to the use of SPSS and taught these courses to numerous SPSS users. He also managed the technical support and statistics groups at SPSS. Along with Norman Nie, the founder of SPSS and Jane Junn, a political scientist, he co-authored Education and Democratic Citizenship. Dr. Stehlik-Barry has used SPSS extensively to analyze data from SPSS and IBM customers to discover valuable patterns that can be used to address pertinent business issues. He received his PhD in Political Science from Northwestern University and currently teaches in the Masters of Science in Predictive Analytics program there.
Read more about Ken Stehlik-Barry

author image
Anthony Babinec

Anthony J. Babinec joined SPSS as a Statistician in 1978 after assisting Norman Nie, SPSS founder, in a research methods class at the University of Chicago. Anthony developed SPSS courses and trained many SPSS users. He also wrote many examples found in SPSS documentation and worked in technical support. Anthony led a business development effort to find products implementing then-emerging new technologies such as CHAID decision trees and neural networks and helped SPSS customers successfully apply them. Anthony uses SPSS in consulting engagements and teaches IBM customers how to use its advanced features. He received his BA and MA in Sociology with a specialization in Advanced Statistics from the University of Chicago and teaches classes at the Institute for Statistics Education. He is on the Board of Directors of the Chicago Chapter of the American Statistical Association, where he has served in different positions including President.
Read more about Anthony Babinec