Chapter 6. Link Your Data Using Data Models
This chapter will take us back to the data preparation stage. Sometimes, your data is in multiple places, and it will make your life easier if the data was present in one sheet. We will use Excel's data model feature to combine data from multiple sources into one. We will also discuss the database concepts but nothing too advanced. In terms of Excel, this new data model replaces the use of the well-known VLOOKUP function in some instances. We will merge the three datasets from the Fast Forms website that we learned about in Chapter 5, Analyzing Data Using Descriptive Statistics and Charts. Fasten your seat belts as the next few sections will come and go in a flash.
This part is going to be easy because the data has already been gathered and it is available in the Chapter 05 folder. It contains three CSV files and each file represents a specific table in the database.
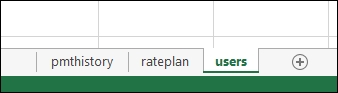
Fire up Excel 2013 and create a new spreadsheet. Create two more tabs in addition to the Sheet1 tab that has already been created for you by default. Rename Sheet1, Sheet2, and Sheet3 as pmthistory, rateplan, and users, respectively, as shown in the following screenshot:
Copy the data from the three spreadsheets to their respective tabs:
Pmthistory.csv to the pmthistory tab
Rateplan.csv to the rateplan tab
Users.csv to the users tab
You will now have 138 rows in the pmthistory tab, two rows in the rateplan tab, and five rows in the users tab.
Tip
As an alternative, you can also use the Move or Copy sheet option that we learned in Chapter 1, Getting Data into Excel, to copy the data into a new workbook.
Create a new tab and call it report. Note that you can click and drag the tabs...
Now that we have gathered our data, we can start asking questions of interest about our dataset. For example, we can ask how much money did Fast Forms make in 2014? To answer this question, we will start by using the well-known VLOOKUP function, and then, we will use the exciting new data model's features.
The pmthistory table has all of the applications that were submitted in 2014. It does not have the dollar amount that was charged to the customer. It does have a column named rateplanid and this column points to the table called rateplan that will tell us the dollar amount we are looking for. In the database world, the rateplanid column in the pmthistory table is known as a foreign key. The column id in the rateplan table is known as the primary key. Let's create a VLOOKUP function to pull the price column from the rateplan table into the pmthistory table:
Select the pmthistory tab and type price into cell G1, as shown here:
In cell G2, type =vlookup and then select cell D2...
With our data, we can try to answer the question we posted in the Preparing data section of this chapter. We'll start by creating a pivot table and then create our data model that we have been promising:
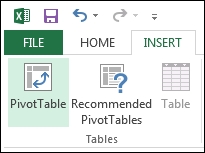
Select the pmthistory tab and select any cell with data in it. Navigate to the INSERT tab and click on the PivotTable button.
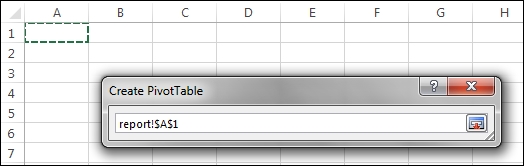
In the Create PivotTable dialog box, select the Existing Worksheet option, and click on the Location button.
When the dialog box appears, select the report tab and click on cell A1, as shown in the following screenshot. After cell A1 is selected, press the Enter key on your keyboard and then click on OK in the dialog box.
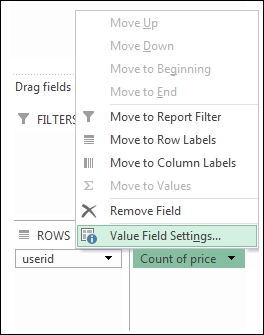
In the PivotTable wizard, choose the userid and price columns, as shown in the following screenshot. The only issue is that we want to take the sum and not the count of the price column. Let's change this in step 5.
Click on the Count of price drop-down menu and select the Value Field Settings... option.
Choose sum and click on the OK button...
What are data models? They are just models, which you create, that allow you to combine data from multiple sources.
Why data models? In reality, you do not need to use data models at all. Filters, formulas, and pivot tables are sufficient for all your data needs. Data models, however, give you the ability to work with larger datasets than your typical Excel sheet can handle. They also allow you to combine data from multiple tables without using VLOOKUPS. The following example shows you how this can be done:
Select the pmthistory tab and then select any cell with data in it. Navigate to the INSERT tab and click on the PivotTable button, as we did in Analyzing data section of this chapter. Also, select the location where we want to place the table in cell D1. We will also need to check the Add this data to the Data Model option, as shown in the following screenshot. Finally, click on the OK button.
Click on the ALL tab, and you will be able to see all of your tables. This means that...
I hope you enjoyed this chapter and all of the previous ones leading up to this point. By now, you should be very competent and able to understand the data analysis life cycle. We covered most of the stages except the presentation stage. This chapter focused on building your data preparation skills. It took us a while to get to the data models, but it was important to go through the previous steps so that you could appreciate this new functionality. There is a lot more that we could have done in this chapter, and I'm sure that we could create a book just on data models but we only had one chapter in this case. If you have one of the premium versions of Excel, there are a lot more tools that can be used in conjunction with data models, such as Power View, but I will let you discover this on your own. Being able to merge data from various sources and slice your data using data from various places is a skill that we practiced in this chapter. We were able to answer insightful questions...
 Argentina
 Australia
 Austria
 Belgium
 Brazil
 Bulgaria
 Canada
 Chile
Chile
 Colombia
 Cyprus
 Czechia
 Denmark
 Ecuador
 Egypt
Egypt
 Estonia
 Finland
 France
 Germany
 Great Britain
 Greece
 Hungary
 India
India
 Indonesia
 Ireland
 Italy
Italy
 Japan
Japan
 Latvia
 Lithuania
 Luxembourg
 Malaysia
 Malta
Malta
 Mexico
 Netherlands
 New Zealand
 Norway
 Philippines
 Poland
 Portugal
 Romania
 Russia
 Singapore
 Slovakia
 Slovenia
 South Africa
 South Korea
 Spain
Spain
 Sweden
 Switzerland
 Taiwan
 Thailand
 Turkey
 Ukraine
 United States