Reader small image

You're reading from  Clojure for Data Science

Product typeBook
Published inSep 2015
Reading LevelIntermediate
Publisher
ISBN-139781784397180
Edition1st Edition
Languages
Right arrow
Author (1)
Henry Garner
Henry Garner
author image
Henry Garner

Henry Garner is a graduate from the University of Oxford and an experienced developer, CTO, and coach. He started his technical career at Britain's largest telecoms provider, BT, working with a traditional data warehouse infrastructure. As a part of a small team for 3 years, he built sophisticated data models to derive insight from raw data and use web applications to present the results. These applications were used internally by senior executives and operatives to track both business and systems performance. He then went on to co-found Likely, a social media analytics start-up. As the CTO, he set the technical direction, leading to the introduction of an event-based append-only data pipeline modeled after the Lambda architecture. He adopted Clojure in 2011 and led a hybrid team of programmers and data scientists, building content recommendation engines based on collaborative filtering and clustering techniques. He developed a syllabus and copresented a series of evening classes from Likely's offices for professional developers who wanted to learn Clojure. Henry now works with growing businesses, consulting in both a development and technical leadership capacity. He presents regularly at seminars and Clojure meetups in and around London.
Read more about Henry Garner

Right arrow

Visualizing different populations


Let's remove the filter for weekdays and plot the daily mean dwell time for both week days and weekends:

(defn ex-2-12 []
  (let [means (->> (load-data "dwell-times.tsv")
                   (with-parsed-date)
                   (mean-dwell-times-by-date)
                   (i/$ :dwell-time))]
    (-> (c/histogram means
                     :x-label "Daily mean dwell time unfiltered (s)"
                     :nbins 20)
        (i/view))))

The code generates the following histogram:

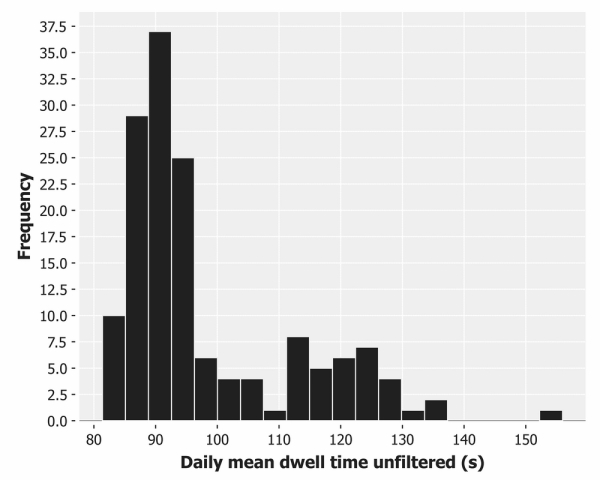
The distribution is no longer a normal distribution. In fact, the distribution is bimodal—there are two peaks. The second smaller peak, which corresponds to the newly added weekend data, is lower both because there are not as many weekend days as weekdays and because the distribution has a larger standard error.

Note

In general, distributions with more than one peak are referred to as multimodal. They can be an indicator that two or more normal distributions have been combined...

lock icon
The rest of the page is locked
Previous PageNext Page
You have been reading a chapter from
Clojure for Data Science
Published in: Sep 2015Publisher: ISBN-13: 9781784397180

Author (1)

author image
Henry Garner

Henry Garner is a graduate from the University of Oxford and an experienced developer, CTO, and coach. He started his technical career at Britain's largest telecoms provider, BT, working with a traditional data warehouse infrastructure. As a part of a small team for 3 years, he built sophisticated data models to derive insight from raw data and use web applications to present the results. These applications were used internally by senior executives and operatives to track both business and systems performance. He then went on to co-found Likely, a social media analytics start-up. As the CTO, he set the technical direction, leading to the introduction of an event-based append-only data pipeline modeled after the Lambda architecture. He adopted Clojure in 2011 and led a hybrid team of programmers and data scientists, building content recommendation engines based on collaborative filtering and clustering techniques. He developed a syllabus and copresented a series of evening classes from Likely's offices for professional developers who wanted to learn Clojure. Henry now works with growing businesses, consulting in both a development and technical leadership capacity. He presents regularly at seminars and Clojure meetups in and around London.
Read more about Henry Garner