Reader small image

You're reading from  Clojure for Data Science

Product typeBook
Published inSep 2015
Reading LevelIntermediate
Publisher
ISBN-139781784397180
Edition1st Edition
Languages
Right arrow
Author (1)
Henry Garner
Henry Garner
author image
Henry Garner

Henry Garner is a graduate from the University of Oxford and an experienced developer, CTO, and coach. He started his technical career at Britain's largest telecoms provider, BT, working with a traditional data warehouse infrastructure. As a part of a small team for 3 years, he built sophisticated data models to derive insight from raw data and use web applications to present the results. These applications were used internally by senior executives and operatives to track both business and systems performance. He then went on to co-found Likely, a social media analytics start-up. As the CTO, he set the technical direction, leading to the introduction of an event-based append-only data pipeline modeled after the Lambda architecture. He adopted Clojure in 2011 and led a hybrid team of programmers and data scientists, building content recommendation engines based on collaborative filtering and clustering techniques. He developed a syllabus and copresented a series of evening classes from Likely's offices for professional developers who wanted to learn Clojure. Henry now works with growing businesses, consulting in both a development and technical leadership capacity. He presents regularly at seminars and Clojure meetups in and around London.
Read more about Henry Garner

Right arrow

Histograms


A histogram is one way to visualize the distribution of a single sequence of values. Histograms simply take a continuous distribution, bin it, and plot the frequencies of points falling into each bin as a bar. The height of each bar in the histogram represents how many points in the data are contained in that bin.

We've already seen how to bin data ourselves, but incanter.charts contains a histogram function that will bin the data and visualize it as a histogram in two steps. We require incanter.charts as c in this chapter (and throughout the book).

(defn ex-1-12 []
  (-> (load-data :uk-scrubbed)
      (i/$ "Electorate")
      (c/histogram)
      (i/view)))

The preceding code generates the following chart:

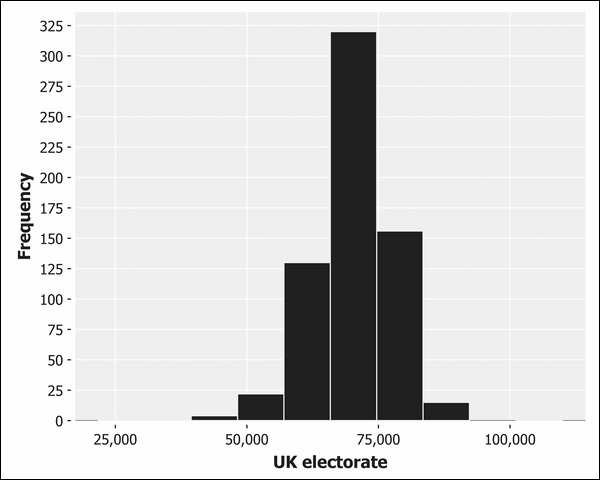
We can configure the number of bins data is segmented into by passing the keyword argument :nbins as the second parameter to the histogram function:

(defn ex-1-13 []
  (-> (uk-electorate)
      (c/histogram :nbins 200)
      (i/view)))

The preceding graph shows a single, high peak but expresses the shape of the data quite crudely. The following graph shows fine detail, but the volume of the bars obscures the shape of the distribution, particularly in the tails:

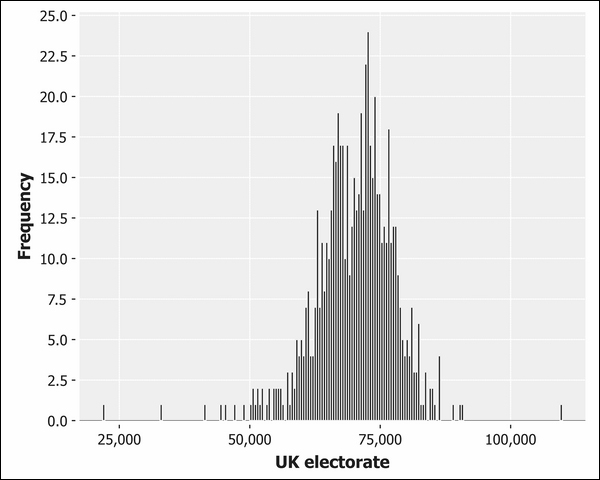
Choosing the number of bins to represent your data is a fine balance—too few bins and the shape of the data will only be crudely represented, too many and noisy features may obscure the underlying structure.

(defn ex-1-14 []
  (-> (i/$ "Electorate" (load-data :uk-scrubbed))
      (c/histogram :x-label "UK electorate"
                   :nbins 20)
      (i/view)))

The following shows a histogram of 20 bars instead:

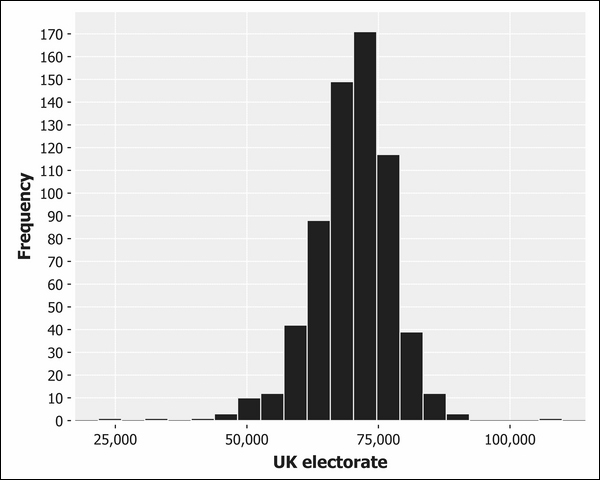
This final chart containing 20 bins seems to be the best representation for this data so far.

Along with the mean and the median, the mode is another way of measuring the average value of a sequence—it's defined as the most frequently occurring value in the sequence. The mode is strictly only defined for sequences with at least one duplicated value; for many distributions, this is not the case and the mode is undefined. Nonetheless, the peak of the histogram is often referred to as the mode, since it corresponds to the most popular bin.

We can clearly see that the distribution is quite symmetrical about the mode, with values falling sharply either side along shallow tails. This is data following an approximately normal distribution.

Previous PageNext Page
You have been reading a chapter from
Clojure for Data Science
Published in: Sep 2015Publisher: ISBN-13: 9781784397180
Register for a free Packt account to unlock a world of extra content!
A free Packt account unlocks extra newsletters, articles, discounted offers, and much more. Start advancing your knowledge today.
undefined
Unlock this book and the full library FREE for 7 days
Get unlimited access to 7000+ expert-authored eBooks and videos courses covering every tech area you can think of
Renews at $15.99/month. Cancel anytime

Author (1)

author image
Henry Garner

Henry Garner is a graduate from the University of Oxford and an experienced developer, CTO, and coach. He started his technical career at Britain's largest telecoms provider, BT, working with a traditional data warehouse infrastructure. As a part of a small team for 3 years, he built sophisticated data models to derive insight from raw data and use web applications to present the results. These applications were used internally by senior executives and operatives to track both business and systems performance. He then went on to co-found Likely, a social media analytics start-up. As the CTO, he set the technical direction, leading to the introduction of an event-based append-only data pipeline modeled after the Lambda architecture. He adopted Clojure in 2011 and led a hybrid team of programmers and data scientists, building content recommendation engines based on collaborative filtering and clustering techniques. He developed a syllabus and copresented a series of evening classes from Likely's offices for professional developers who wanted to learn Clojure. Henry now works with growing businesses, consulting in both a development and technical leadership capacity. He presents regularly at seminars and Clojure meetups in and around London.
Read more about Henry Garner