

In Chapter 3, Using the DAQ Assistant to Automatically Generate LabVIEW Code, we used an automated version of data acquisition. That was a quick and simple way for us to demo the power and some of the capabilities of LabVIEW. Needless to say, hardly any real-life situation is that simple and straightforward. In this chapter, we will formally define "data acquisition" and transform real-life phenomena such as voltage, light, temperature, and humidity, and transform the data such that it is understandable by a computer. In this chapter, we will use a Tektronix TDS 2022 scope and a Korad programmable power supply.
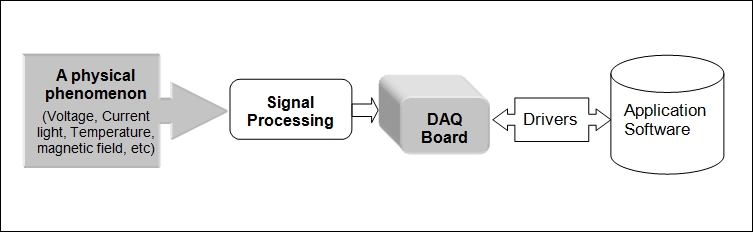
In the broadest context, data acquisition is the process of converting a real-life physical occurrence or phenomenon into computer-understandable data. National Instruments (refer to the official NI Certification Course Manual) breaks down this process into the following segments:
In Chapter 3, Using the DAQ Assistant to Automatically Generate LabVIEW Code, we generated a signal waveform and captured it through a USB DAQ. We used automation to accomplish this task. Although automation can be handy in many circumstances, the fact is, real-life data acquisition, especially in a more elaborate and complex environment, cannot possibly be available in preautomated form, and one must use standard LabVIEW functions and/or write customized functions from the ground up. In this chapter, we will use standard LabVIEW functions to acquire data and present it in human-understandable form. However, to establish a coherent comparison between what we did automatically (in other words, using express VIs) and how it might be done using standard functions (functions that are installed by LabVIEW) or custom functions (in other words, functions that are provided as drivers by a specific vendor) or those written by a LabVIEW programmer, we will redo the...
In this example, the hardware connection is exactly the same as it was in chapter 3. That is, we will directly connect the signal generator to USB DAQ 6008. We will use Analog Input 1. However, the Signal generator is set to generate a Staircase signal in this example.
Launch LabVIEW and start a new VI from the file menu and continue with the following steps:
Right click on the Block Diagram window and from Functions, select Measurement I/O, select NI-DAQmx and tack this pallet to the Block Diagram window. Now you can move this pallet to the appropriate location in your screen to make choosing and placing a Function on the Block Diagram and Front Panel windows with much ease and enhance the visibility of different windows. Note that when you move the mouse cursor on any Function icon, the complete name of the function is displayed. The same is true for each input and output of the any given function. Click on detail help, where available, to get further information...
We will attempt to duplicate the preceding example, this time using an oscilloscope. Here, we will be controlling an oscilloscope remotely. There should be little need to explain why it is necessary to be able to control an oscilloscope with LabVIEW. Aside from the actual various measurements that an oscilloscope can provide (beyond the scope of this book), it is essential to know how to connect to and use a given oscilloscope as one of the most important test and measurement instruments in use. When choosing an oscilloscope to automate and/or acquire data using LabVIEW, a few points are essential:
Price
Ability to be remotely controlled (Serial, Parallel, GPIB, Ethernet, and so on)
Controlling protocol and driver software
Obviously, hardware products from National Instruments (NI) are most suitable for this purpose. But there are many occasions that certain required hardware is not available through NI. There are also other reasons that makes third-party...
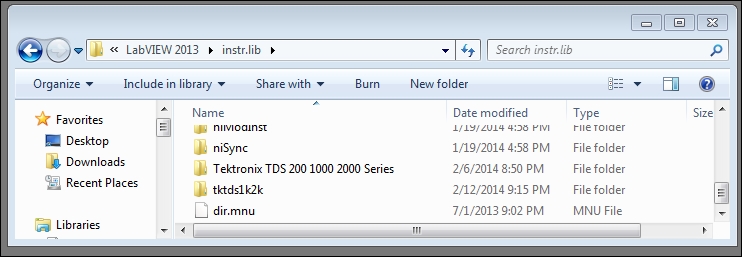
Next, we need to make sure that software drivers are correctly installed in LabVIEW for the correct model of the instrument we have: the oscilloscope. Some vendors provide the software in the box with the hardware sold. Otherwise, a little search on the NI site will do the job. Usually, there are two flavors of the drivers for these devices: "Plug and Play" as well as "Plug and play (project style)". Complete and detailed installation is also available on the NI site. Note the path and two versions of the drivers installed. This is for demo and installation of both versions, while perfectly OK but not necessary useful. Note that if you are planning on making an application with an installer out of your VI(s), all drivers and non LabVIEW standard functions need to be included in the process of creating an installer for the application:
Once the software has installed properly, it will appear on your functions plug when you click on the Block...
In this example, we will use a programmable power supply to step through five different voltages (since we use an array, the number of voltages can be as many as the number of array elements). We will send SCPI commands to a programmable power supply (KORAD KA3005P programmable DC power supply) to set the voltage. In the next step, we query the instrument to report back the value that the power supply is currently set on. Finally, we will collect all the returned values in a different array.
The power supply is connected to the LabVIEW computer via USB. We will use serial communication to send commands and collect returned values. The communication part of the VI is achieved via a SUB VI called Serial P.P.S.
To achieve the prceding scenario, we will only need four SCPI commands:
OUT1: This will set the output to ON mode
VSET1: This will set the output channel 1 to <value> volts
VSET1 : This will query voltage at channel 1
OUT0: This will turn the output off
Note...
To create a sub VI, follow these steps:
Right click on Block Diagram and from Instrument I/O choose the VISA pallet.
From the VISA pallet:
Place a "VISA Configure serial port".
Connect a "Control" to the input.
Default baud rate is 9600 and you may connect a constant to it, or just leave it to use the default value.
Place a "VISA write" and connect the serial reference wire and error wires.
Add a control to the input wire of the "VISA write".
Place a variable control delay (use Functions Programming Structures Flat sequence).
Place a "VISA Property Node" and connect the serial reference line. Right click on the property node and choose "Bytes at Port".
Place a "Read Visa" and connect the input and output wires as diagram here:

Finally, create a SUB VI.
What this VI attempts to do is simply set five different voltages and query the current value every time that a new value is set. We also need to set the output of the power supply to ON mode in the beginning and set it to OFF at the end. We are going to use an array to send SCPI commands to achieve each step.
We begin by creating this unpopulated array:
Place an "Array constant" on the Block Diagram: Functions | Programming | Array | array Constant.
Drop a "String Constant" on the "Array Constant": Functions | Programming | String | String Constant.
Fill the array element as shown in the VI. The array should have 12 elements:

Add a "For Loop": Functions Programming Structures "For Loop".
Drop the SUB VI we built inside the "For Loop": Functions Select a VI... navigate, and find the SUBVI and place it inside the "For Loop".
Place a "Build Array" inside the loop. Click on "Build Array" and expand it to two inputs.
Connect the "Read buffer" output of the SUB VI and connect...
As you will most likely notice, there are empty array elements in the output array on the Front Panel of this VI. See the previous array. There are very fundamental reasons I have left the VI as is (that is, if the purpose of the VI is to collect voltages, obviously we are not interested in blank array elements). Fundamental to data acquisition is verification of the data acquired in clearly defined milestones. Here we use "milestone" in the broadest sense of the word. A milestone may be the values a SUB VI is programmed to do or how a complete product is designed to function. Usually, a product is the end result of the labor of different teams of engineers working in collaboration. What may be considered the end of a working product (or part of a product) for a team of developers often is not where the collaborating team may be able to directly start to resume further development. A temperature sensor may send actual temperature values in string form, then again many...
In this revision of the Power Supply Voltage Steps example, we will accomplish three tasks:
We will create a SUB VI to collect voltages from an oscilloscope
We will add condition selections such that the blank array elements are removed
We will add code to display measured voltage as opposed to set voltages
To create a SUB VI that will use the oscilloscope to display the measured voltages that the power supply puts out, we will do the following:
From the Tektronix functions pallet, choose and place "Initialize.vi" and "Read Measurement.vi" on a Block Diagram of a new VI.
Connect a Boolean False to the "Reset" input of the Initialize.vi.
Connect serial input and output VISA as in the following diagram.
Right click on the "Measurement Type" input of the measurement type VI and choose "Mean" from the drop-down menu.
Create a SUB VI and save all:

With this SUB VI in place, we can modify the original VI to implement parts 2 and 3.
There are four main changes needed...
In this chapter, we started by defining what precisely the definition of data acquisition is. Further, we went through programs that actually used a programmable power supply and an oscilloscope where we set the power supply to specific values and measured the true output value of the power supply via an oscilloscope.
In the next chapter, we begin with debugging issues.
The rest of the chapter is locked
You have been reading a chapter from
Data Acquisition Using LabVIEWPublished in: Dec 2016Publisher: PacktISBN-13: 9781782172161
Register for a free Packt account to unlock a world of extra content!
A free Packt account unlocks extra newsletters, articles, discounted offers, and much more. Start advancing your knowledge today.
undefined
Unlock this book and the full library FREE for 7 days
Get unlimited access to 7000+ expert-authored eBooks and videos courses covering every tech area you can think of
Renews at €14.99/month. Cancel anytime