It is easy to think of library items in a self-service context. Don't get me wrong; ultimately, you will have to decide what will be published – from your data model to the world for their own analysis purposes. Having said that, the secret sauce of this recipe is in saving your own time.
It is a productivity hack that implies, "Automation is to your time what compound interest is to money." While it is not an exact parallel, this is a nice concept to frame the usefulness of time-saving functions in Qlik Sense. The effective use of the library saves time spent on scrolling downfield lists, rewriting expressions over and over, and applying a single change in multiple places.
Once you have saved enough time to eclipse the setup investment, the value of taking this approach can only compound with continuous development.
- Create a new Qlik Sense application and name it
Master Library. - Open the
Data load editor.
- Enter the following script and load the data by clicking on the button (the script is available in a separate text file that can be downloaded from the
Packt Publishing website):
Data:
LOAD * INLINE [
Name, Region, Country, City, OrderId, Sales, Company,
OrderDate
Wooten, C, Mozambique, Carmen, 1, 45.55, Est Nunc
Laoreet LLC, 22/12/14
Blankenship, Delta, Cayman Islands, Sapele, 2, 95.76,
Lorem Donec Inc., 17/01/15
Sheppard, Wyoming, Vatican City State, Cheyenne, 3,
38.31, Lobortis, 07/08/14
Goddard, H, Curaçao, San Francisco, 4, 86.33, Non Inc.,
07/09/14
Galloway, Aragón, Trinidad & Tobago, Zaragoza, 5,
85.80, Diam Proin., 21/01/15
Kirsten, Tamil Nadu, Wallis & Futuna, Neyveli, 6,
28.47, Mollis Non Limited, 03/05/14
Holland, Cartago, Falkland Islands, San Diego, 7, 1.34,
Ullamcorper Inc., 17/07/14
Thaddeus, BC, Canada, Oliver, 8, 59.04, Ante Nunc
Mauris Ltd, 17/02/15
Lareina, CA, Spain, San Diego, 9, 4.55, Pellentesque
Tincidunt Limited, 29/07/14
Jescie, Vienna, Monaco, Vienna, 10, 54.20, Ultricies
Ligula Consulting, 16/06/14
Logan, IL, Saint Barthélemy, Paris, 11, 91.31, Mi
Foundation, 13/12/14
Shannon, CG, Nepal, Aberystwyth, 12, 80.86, Auctor Non
LLC, 03/05/14
Andrew, SO, Argentina, Sokoto, 13, 88.78, Scelerisque
Mollis Associates, 12/12/14
Jocelyn, WP, Tanzania, Konin, 14, 15.91, Ligula Tortor
Dictum Ltd, 22/08/14
Gordon, FL, Hong Kong, Miami, 15, 93.97, Suscipit Inc.,
12/05/14
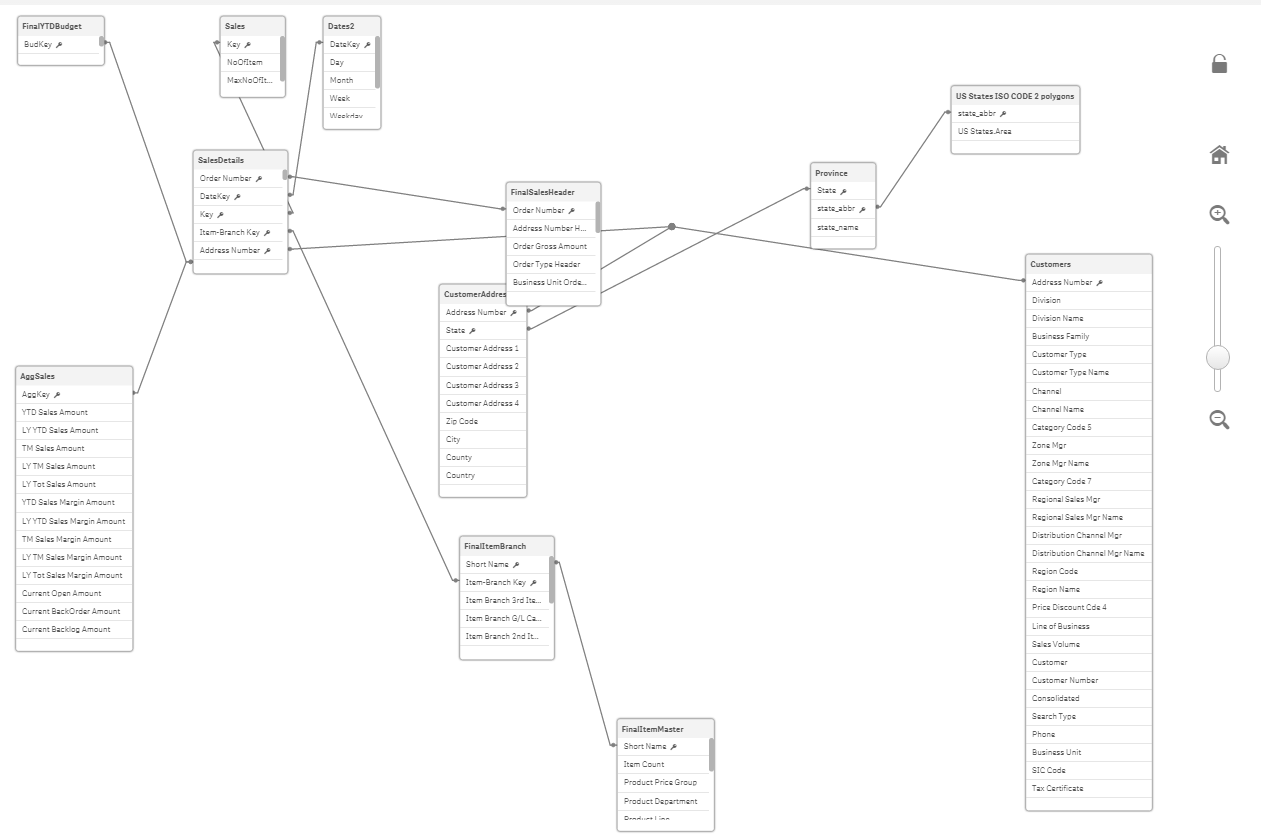
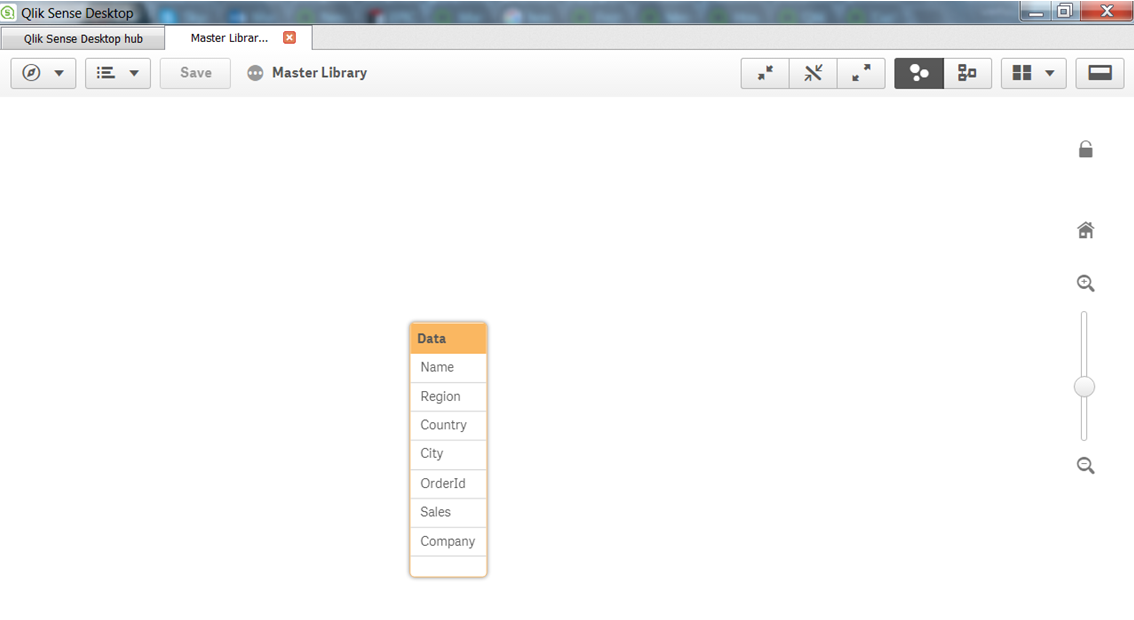
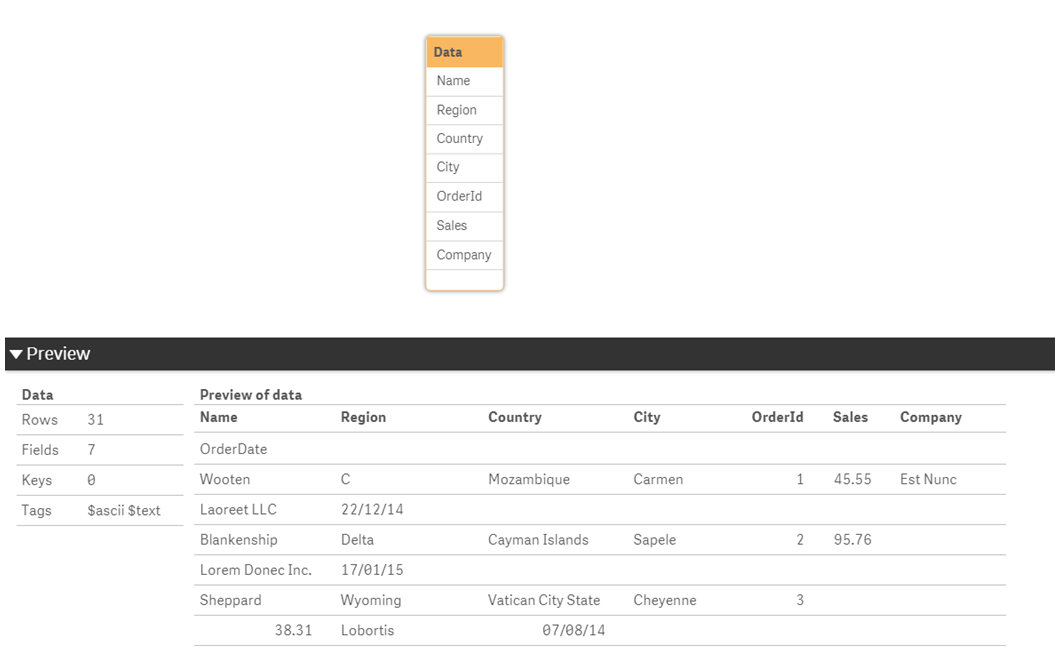
];Once the data has been loaded, you can check the results by opening the Data model viewer through the Navigation dropdown () in the top corner on the left-hand side of the toolbar, as shown in the following screenshot:
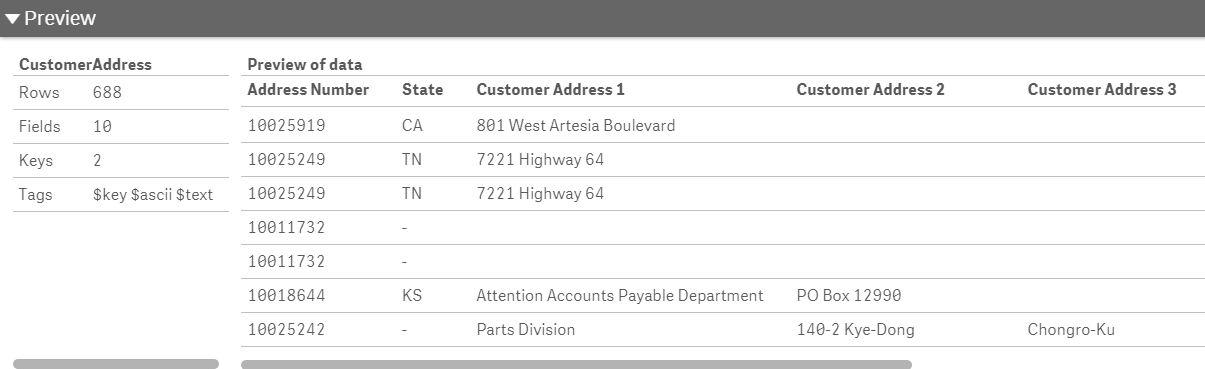
You can find the Preview button at the bottom-left of the screen. There are several other places in Qlik Sense where you can create master library items, but the data model preview screen is the best, as it also lets you see the data first. Take a minute to browse the data you have loaded in the Data model viewer:
- In the
Data model viewer, select the Data table by clicking on its header and then click the Preview button to view the fields and the field values loaded from the Data table.
- The
Preview window will appear, as shown in the following screenshot:
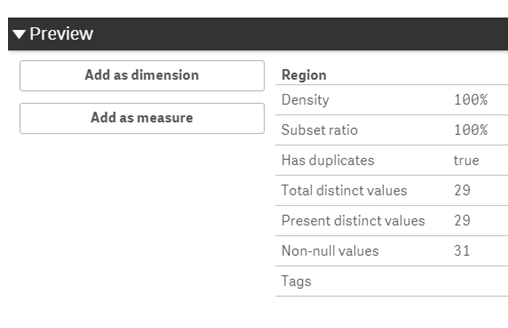
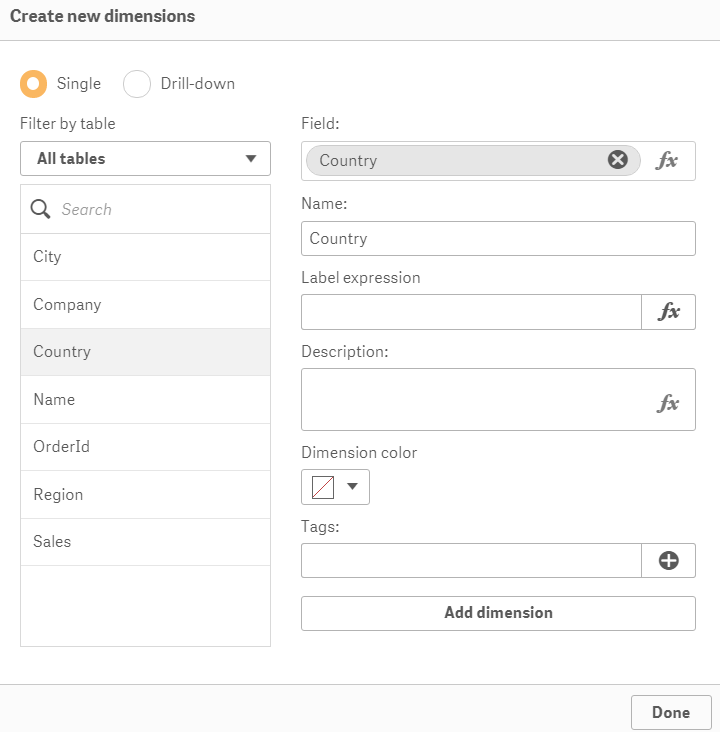
- Select the
Region field from the table to get the preview, as shown in the following screenshot:
- Click the
Add as dimension button. - The following window appears. If you are likely to publish this dimension for consumption by users, you can enter a description here:
- It is advised to use tags to make our life easier. Add the
Geo tag and click on - Click on the
Add dimension button to create a master dimension in the library. - Repeat this process for the
Country and City fields.
- Click on
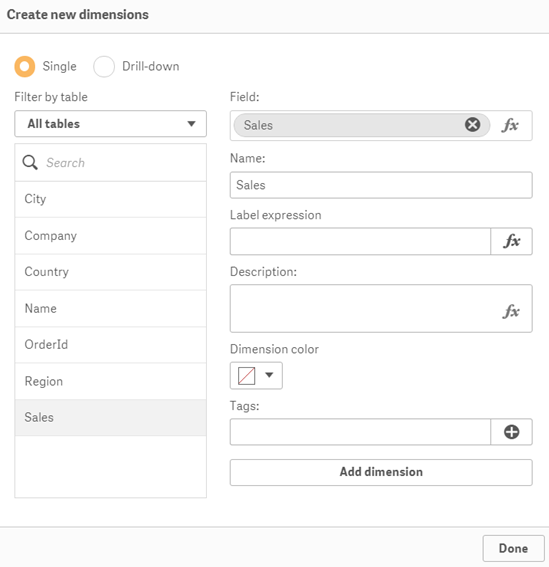
Done to go back to the Data model viewer. - It's time to create a measure. Select the
Sales field from the Data table in the Data model viewer. - Click the
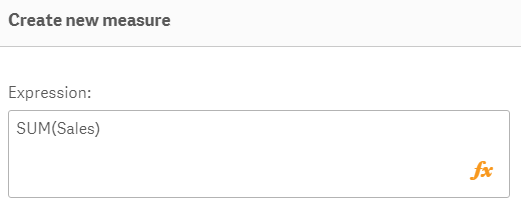
Add as measure button. When we create a Master measure, we need to make sure we use an aggregation function, such as Sum or Avg, along with the selected field. - In the
Create new measure window, type SUM in front of (Sales), as shown in the following screenshot:
- Click on
Create. - Save the changes made in the master library by clicking on the button on the toolbar in the table preview. Exit the table preview by going to
App overview. - Open (or create) a sheet and enter the edit mode by clicking on the Edit sheet button.
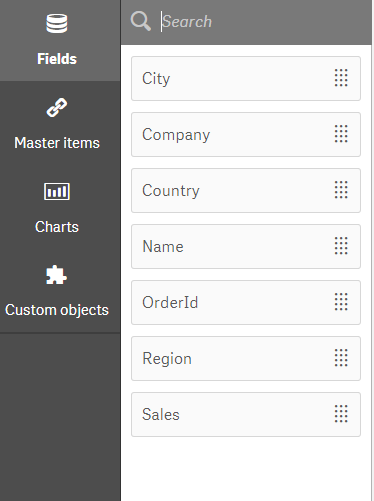
- Once you are in edit mode, click the chain () icon on the left-hand side of the asset panel to open the
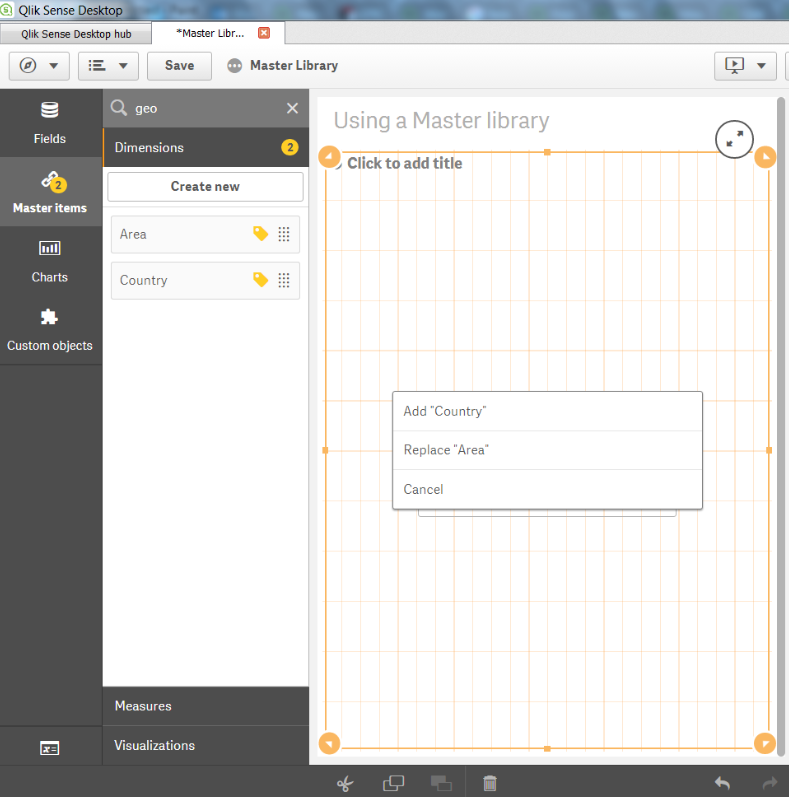
Master items menu. - To add visualizations, first create them in the user interface and then drag them into the library.
While the Master items menu panel is very useful to speed up the development when defining the content, it is easier to do it from the filters pane. In short, you can browse the entire content of your data model and right-click on the most important fields to add the ones that will be frequently used.
 Argentina
 Australia
 Austria
 Belgium
 Brazil
 Bulgaria
 Canada
 Chile
Chile
 Colombia
 Cyprus
 Czechia
 Denmark
 Ecuador
 Egypt
Egypt
 Estonia
 Finland
 France
 Germany
 Great Britain
 Greece
 Hungary
 India
India
 Indonesia
 Ireland
 Italy
Italy
 Japan
Japan
 Latvia
 Lithuania
 Luxembourg
 Malaysia
 Malta
Malta
 Mexico
 Netherlands
 New Zealand
 Norway
 Philippines
 Poland
 Portugal
 Romania
 Russia
 Singapore
 Slovakia
 Slovenia
 South Africa
 South Korea
 Spain
Spain
 Sweden
 Switzerland
 Taiwan
 Thailand
 Turkey
 Ukraine
 United States