


The last section of this chapter will show you how you can diagnose and monitor App Services that you've deployed. Those operations are crucial when you have a working application, as errors and performance issues always crop up, especially in popular services. Thanks to multiple integrated tools in Azure Web Apps, you can be sure that you'll always have enough information to find and fix a problem.
Diagnostics and monitoring of App Services
The Overview blade
The very first thing you probably already noticed is the charts visible in the Overview blade:
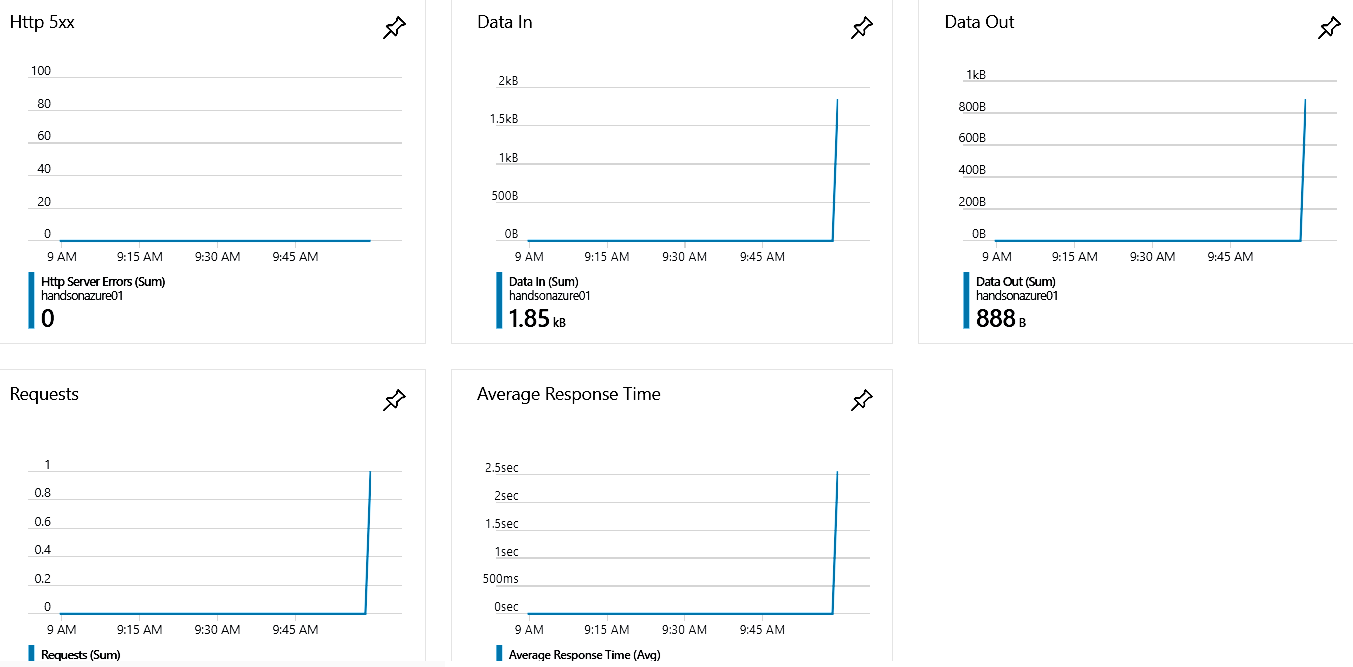
They provide basic insight into the behavior of your application, such as data transfer, the number of requests, or HTTP 500 errors. Let's click on any of those charts—you will see another important screen, which we will look at now.
Metrics
The Metrics blade gives you more detailed information and a better view of a specific parameter. On the left, there are many different metrics to choose from. You create your own chart by selecting more than only one parameter.
Remember that you can only choose metrics of the same unit—there is no possibility, for example, to connect the number of loaded assemblies and average response time.
On this screen, you can also change the chart's time range. This is very useful when searching for related issues (such as Data In and Memory working set to check how much memory your application needs to handle incoming data).
Monitoring
Let's go back to the main screen of App Service. There, when you scroll down, you will see a MONITORING section containing even more useful features.
Click on the Log stream blade. You will see a black screen with the following information:
Application logs are switched off. You can turn them on using the 'Diagnostic logs' settings.
Apparently, we do not have this feature available for now. Let's go to the Diagnostic log blade. It offers some interesting features regarding logging, including the following:
- Application logging (filesystem): Collects diagnostic traces
- Application logging (blog): The same as the filesystem option, but this time logs are stored within the Azure Storage account
- Web server logging: Gathers diagnostics about a web server
- Detailed error messages: If you feel current messages are not sufficient, you can turn on this feature to get more information
- Failed request tracing: Gathers information about failed requests
Additionally, you can find the FTP location of all logs with user information to log in. Since we need Application logging for Log stream, let's turn this feature on. Now, we can go back to Log stream to see what kind of information we are gathering:
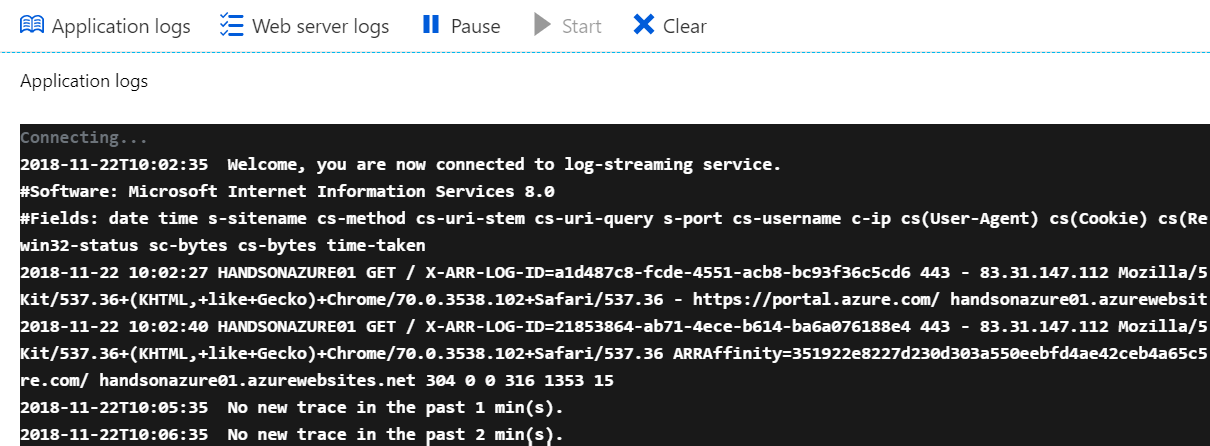
If you do not see any information in Log stream, make sure you have set the correct level of logging. For all information possible, use Verbose.