


 Download code from GitHub
Welcome to Learn Grafana 7.0! Together, we will explore Grafana, an exciting, multi-faceted visualization tool for data exploration, analysis, and alerting. We will learn how to install Grafana, become familiar with some of its many features, and even use it to investigate publicly available real-world datasets.
Whether you are an engineer watching terabytes of metrics for a critical system fault, an administrator sifting through a haystack of log output looking for the needle of an application error, or just a curious citizen eager to know how your city works, Grafana can help you monitor, explore, and analyze data. The key to getting a handle on big data is the ability to visualize it.
But before we find out how Grafana gives you that ability, let's briefly review a few basic concepts behind data visualization.
The following topics will be covered in this chapter:
- Data and visualization – an overview of the data landscape and how visualization is a useful solution
- Why Grafana? What makes Grafana an attractive solution?
- Installing Grafana – getting the Grafana application installed and running
- Connecting to the Grafana server – launching the application from a web browser
Technical requirements
Grafana is relatively easy to set up, but since it is a web server application, you will need to run a few commands to get it running. For the purposes of this book, we will assume that you will access Grafana from the same computer that you installed it on. The following are the technical requirements for installing and running Grafana:
- Familiarity with the command shell
- A terminal application oran SSH to the machine where you plan to install Grafana
- Docker (in order to run Grafana from a Docker container)
- Optionally, you will have the Administrator access to install and run Grafana from the command line, rather than in a Docker container
Tutorial code, dashboards, and other helpful files for this chapter can be found in the book's GitHub repository at https://github.com/PacktPublishing/Learn-Grafana-7.0/tree/master/Chapter01.
Data and visualization
In the not-too-distant past, most of us consumed data pretty much solely via a daily newspaper—on the financial pages, the sports section, and the weather forecast. However, in recent years, the ubiquity of computing power has immersed every part of our lives in a sea of data.
Around the clock, our built environment and devices collect innumerable data, which we consume. Our morning routine starts with a review of emails, social media posts, and news feeds on a smartphone or tablet, and whereas we once put down the daily newspaper when we left for work, our phones come with us everywhere.
We walk around or exercise and our phones capture our activity and location data via the GPS, while our smartwatches capture our vitals. When we browse the web, every single interaction down to a mouse click is logged and stored for analysis. The servers that deliver these experiences are monitored and maintained by engineers on a round-the-clock basis. Marketers and salesforces continually analyze this data in order to make business-critical decisions.
On the way to work, our cars, buses, and trains contain increasingly sophisticated computers that silently log tens of thousands of real-time metrics, using them to calculate efficiency, profitability, engine performance, and environmental impact. Technicians evaluating these physical systems' health or troubleshooting problems often sift through an enormous stream of data to tease out the signs of a faulty sensor or a failed part. The importance of this data is globally recognized. This is precisely why data recorders are the most valuable forensic artifact after any transportation accident, and why their recovery generates such widespread media coverage.
Meanwhile, in the modern home, a smart thermostat dutifully logs the settings on a Heating, Ventilation, and Air Conditioning (HVAC) system, as well as the current temperature both inside and outside the house. These devices continually gather real-time weather information in order to make decisions about how and when to run most efficiently.
Similar to the systems at home, but on a much larger scale, nearly every building we pass through during the day collects and monitors the health of a number of key infrastructure systems, from air conditioning to plumbing to security. No amount of paper could possibly record the thousands of channels of data flowing through these physical plants, and yet the building management system aggregates this data to make the same kinds of simple decisions as the homeowner does.
Moreover, these examples represent only a drop in the ocean of data. Around the world, governments, scientists, NGOs, and everyday citizens collect, store, and analyze their own datasets. They are all confronted with the same issue: how to aggregate, collate, or distill the mass of data into a form that a human can perceive and act on in a few seconds or less. The response to this issue is effective data storage and visualization.
Storing, retrieving, and visualizing data
For years, the basic language of data visualization was well-defined: using a chart, graph, histogram, and so on. What has been missing is the ability to rapidly create these charts and graphs not in hours or days but in seconds or even milliseconds. This requires processing power that draws representations of thousands and thousands of data points in the time it takes to refresh a computer display.
For decades, only the most powerful computers could manage the processing power required to visualize data on this scale, and the software they ran was specialized and expensive. However, a number of trends in computing have converged to produce a renaissance in data acquisition and visualization, making it accessible not only to domain practitioners but also to technically proficient members of the general public. They are as follows:
- Cheap general-purpose CPUs and graphics GPUs
- Inexpensive high-capacity storage, optimized for physical size and maximum throughput
- Web standards and technologies, including JavaScript and CSS
- Open source software frameworks and toolkits
- Scalable cloud computation at affordable prices
- Broadband networking to the enterprise, the home, and the mobile device
A common feature of virtually all of this data is that for each sample from a sensor or line in a log file is the snapshot from an invisible ticking clock: atimestamp. A dataset gathered from these data points across a period of time is referred to as atime series. A stored object containing one or more time series is atime-series dataset. An application that can provide optimized access to one or more of these datasets is called, naturally, a time-series database. While a whole class of NoSQL time-series databases, such as InfluxDB,OpenTSDB, andPrometheus, have sprung up, venerable SQL relational databases, such as PostgreSQLandMySQL, have added their own support for time-series datasets.
That's fine for storing and retrieving data, but what about visualizing data? Enter Grafana.
Why Grafana?
While there are many solutions in the data visualization space, Grafana is proving to be one of the most exciting, exhibiting rapid growth in scope and features, broad options for deployment and support, and an enthusiastic community contributing to its future growth. Before going into the specific features that make Grafana an attractive solution, let's take a look at the criteria we might use to characterize a useful data visualization application:

For the purposes of this book, we will be looking at particular software applications that fulfill four major functions:exploration,analysis,presentation, andnotification.
Quickly loading and displaying a dataset with the idea of identifying the particularly interesting features for deeper analysis, sometimes referred to as drilling-down, is an example of dataexploration.
After we have examined our data, we may want toanalyzeit next. That is, we may want to quantify the data statistically or correlate it with other data. For example, we may want to see what the maximum value or average value of the data is for a specific time range. We may also want to look at multiple datasets over the same time period to look for events that might be time-correlated.
Once we have identified the data we are interested in, we will want topresentit in an aesthetically pleasing manner that also gives the viewer clarity about what the data represents, in effect helping to tell a story about the data, which would be otherwise difficult to do without specific domain knowledge.
Finally, we may need to observe the data over time, or even in real-time as it may represent critical data. If the data crosses into a realm of concern, we may need to benotifiedimmediately.
While there are a number of powerful data analytics tools on the market that fulfill these functions, Grafana has a number of features that make it an attractive choice:
- Fast:The Grafana backend is written in Google's exciting new Go language, making it extremely performant when querying data sources or feeding thousands of data points to multiple dashboard panels.
- Open: Grafana supports a plugin model for its dashboard panels and data sources. The number of plugins is constantly growing as the Grafana community enthusiastically contributes to the project.
- Beautiful: Grafana leverages the attractive and powerful D3 library. Many of the popular dashboard tools, such as DataDog and Zabbix, can quickly generate beautiful graphs from thousands of data channels, but they only offer some limited control over the display elements. Grafana provides fine-grained control over most graph elements including axes, lines, points, fills, annotations, and legends. It even offers the much sought-after dark mode.
- Versatile:Grafana is not tied to particular database technology. For example, Kibana is a powerful, well-known member of ElasticSearch's ElasticSearch, Logstash, Kibana (ELK) stack; it is only capable of visualizing ElasticSearch data sources. This gives it the advantage over Grafana of a better ability to integrate ElasticSearch's analysis tools in its graphing panels. However, due to its plugin architecture, Grafana can support a variety of ever-growing databases (at last count, over 30) from traditional RDBMs, such as MySQL and PostgresQL, to modern TSDBs, such as InfluxDB and Prometheus. Not only can each graph display data from a variety of data sources, but a single graph can also combine data from multiple data sources.
- Free:While they are very powerful tools indeed, DataDog and Splunk are commercial packages and, as such, charge fees to manage all but the smallest datasets. If you want to get your feet wet, Grafana is freely available under the Apache open source license, and if you do plan to run it in your enterprise, you can purchase tiered support.
These are just some of the criteria you might use to evaluate Grafana against similar products. Your mileage may vary, but now is a great time to be in the market for visualization tools. Grafana and its competitors each have their own strengths and weaknesses, but they are all very capable applications. Here's a short list of the few we covered:
- Kibana (www.elastic.co)
- Splunk (www.splunk.com)
- Datadog (www.datadoghq.com)
- Zabbix (www.zabbix.com)
With this in mind, let's install Grafana.
Installing Grafana
At its core, Grafana runs as a web server, and as such, it is not a typical double-click application. You will need to be comfortable with the command line and have administrator privileges on the computer you plan to install Grafana on. To download the latest versions of Grafana, check out https://grafana.com/grafana/download.
The Grafana application server runs on *nix operating systems (Linux, OS X,and Windows), and it can be installed locally on a laptop or workstation or on a remote server. It is even available as a hosted application if you'd rather not deal with setting up or managing a server application on your own.
In this section, we'll walk through the most typical installation options:
- Docker
- OS X
- Linux
- Windows
- Hosted Grafana on the cloud
Once you've completed the installation of your choice, proceed to the Connecting to the Grafana serversectionfor instructions on how to access Grafana from a web browser.
Grafana in a Docker container
The easiest and least complex installation method is to run Grafana from within a Docker container. Docker is available for all major platforms and can be downloaded by visitinghttps://www.docker.com/.
After installing Docker, open a terminal window and type in the following command:
$ docker run -d --name=grafana -p 3000:3000 grafana/grafana
Docker will automatically download and run the latest version of Grafana for your computer's architecture. Bear in mind that since this basic container has no persistent storage, nothing will be retained if you delete the container. I suggest you run the container with a temporary volume so that Grafana's internal database will continue to exist, even if you destroy the container:
            $ docker volume create grafana-storage


            $ docker run -d --name
            =


            grafana -p 3000:3000\


            -v grafana-storage:/var/lib/grafana \

            grafana/grafana
I recommend proceeding with Docker for the purposes of this book as it will allow an almost turnkey installation experience, as all the necessary dependencies will be automatically downloaded with the container. It will also install in its own sandbox, so you don't need to worry about installing a stack of software that will be difficult to delete later. Finally, in future chapters we will be setting up data sources using similar Docker containers, so managing the data pipeline as a combination of containers will be very consistent and straightforward.
Grafana for OS X
There are two options for installing and running Grafana for OS X:
- Homebrew
- The command line
Using Homebrew is the simplest option as it wraps all the installation chores in a single command. To get Homebrew, visit https://brew.sh/. If you want more control over where to install Grafana, the command line option is a better choice.
Homebrew
To install via Homebrew, use the following:
$ brew install grafana
If you want to keep Grafana running even after a reboot, use theservices subcommand to launch the installed Grafana application as a service. You will first need to confirm services installation:
          $ brew tap homebrew/services


          $ brew services start grafana
The command line
To install via the command line, open a Terminal shell window and download an OS X distribution tarball, thenuntarit into the directory of your choice (replace $GRAFANA_VERSION with the current version):
          $ wget https://dl.grafana.com/oss/release/grafana-$GRAFANA_VERSION.darwin-amd64.tar.gz


          $ tar -zxvf grafana-$GRAFANA_VERSION.darwin-amd64.tar.gz
Once you'veuntared the file,cdinto the directory and launch the binary:
./bin/grafana-server web
Grafana for Linux
Linux comes in a number of flavors and each has a slightly different installation system. Typically, you download the binary and then run the installer on the package file. To get the latest Grafana binaries for Linux, visit https://grafana.com/grafana/download?platform=linux.
RedHat Linux
The installer for the RedHat distributions (CentOS, RedHat, and Fedora) isyum. To download and install (replacing $GRAFANA_VERSION with the current version), use the following:
          $ wget https://dl.grafana.com/oss/release/grafana-$GRAFANA_VERSION.x86_64.rpm


          $ sudo yum install initscripts urw-fonts


          $ sudo yum localinstall grafana-$GRAFANA_VERSION.x86_64.rpm
To start up Grafana, usesystemd:
          $ systemctl daemon-reload


          $ systemctl start grafana-server


          $ systemctl status grafana-server
To keep Grafana running even after a reboot, use the following:
$ sudo systemctl enable grafana-server.service
Debian Linux
The installer for the Debian distributions (Debian and Ubuntu) isdpkg. To download and install (replace $GRAFANA_VERSION with the current version), use the following:
          $ wget https://dl.grafana.com/oss/release/grafana_$GRAFANA_VERSION_amd64.deb


          $ sudo apt-get install -y adduser libfontconfig1


          $ sudo dpkg -i grafana_$GRAFANA_VERSION_amd64.deb
To start up Grafana, use the following:
          $ systemctl daemon-reload


          $ systemctl start grafana-server


          $ systemctl status grafana-server
To keep Grafana running even after a reboot, use the following:
$ sudo systemctl enable grafana-server.service
Grafana for Windows
Installation for Windows is straightforward:
- Go to https://grafana.com/grafana/download?platform=windows.
- Download the latest MSI installer file from the download link.
- Launch the.msifile to install.
Hosted Grafana on the cloud
If you would rather not install Grafana on your computer, or you don't have access to a computer that can run Grafana, there is another option—Grafana can host a free instance for you. There are restrictions—namely that in order to access a data source, you will need to upgrade a paid subscription—but if you want to follow this book up to the point where we use data sources, hosted Grafana might be a good solution. To sign up for the hosted version, go to https://grafana.com/get and select the link under We Host It.
Connecting to the Grafana server
Once you have installed and launched Grafana, open a browser page to access the Grafana application. It can be found athttp://localhost:3000. If everything goes well, you should see a login page, as follows:
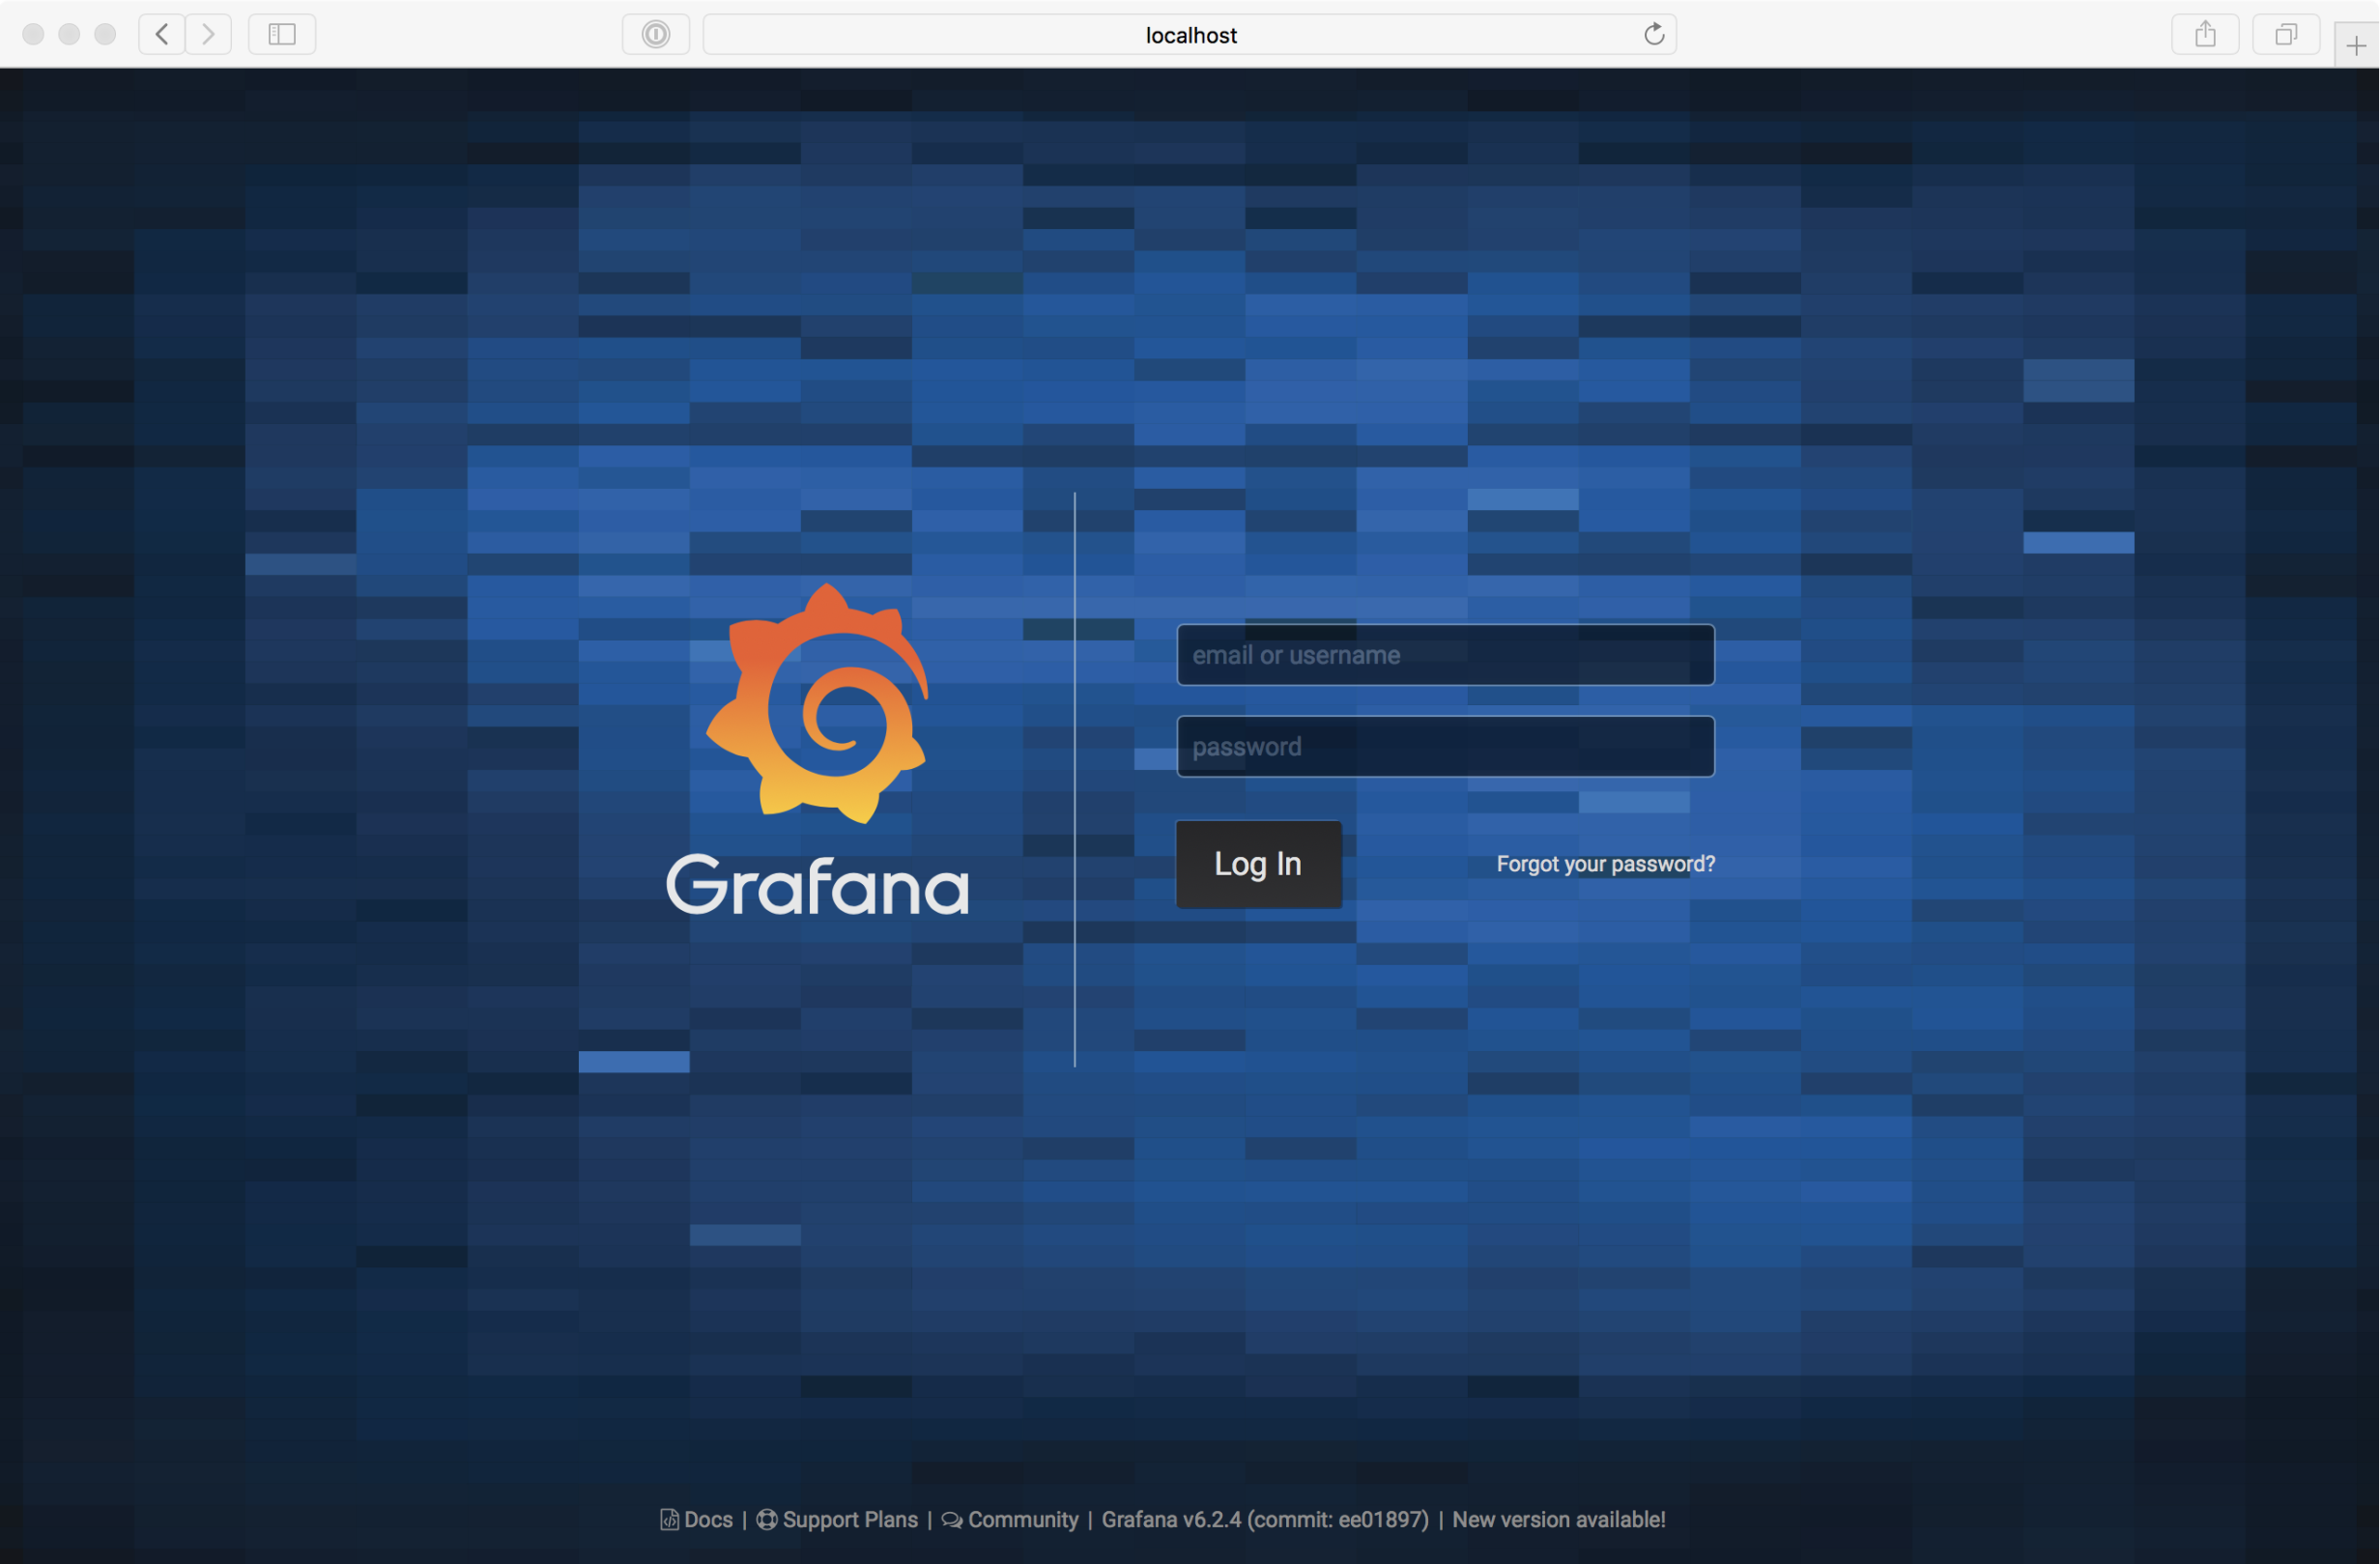
Log in with theadminusernameand theadminpassword. You will then be prompted to change it to something more secure. Once you have logged in, you should see the base Grafana interface:
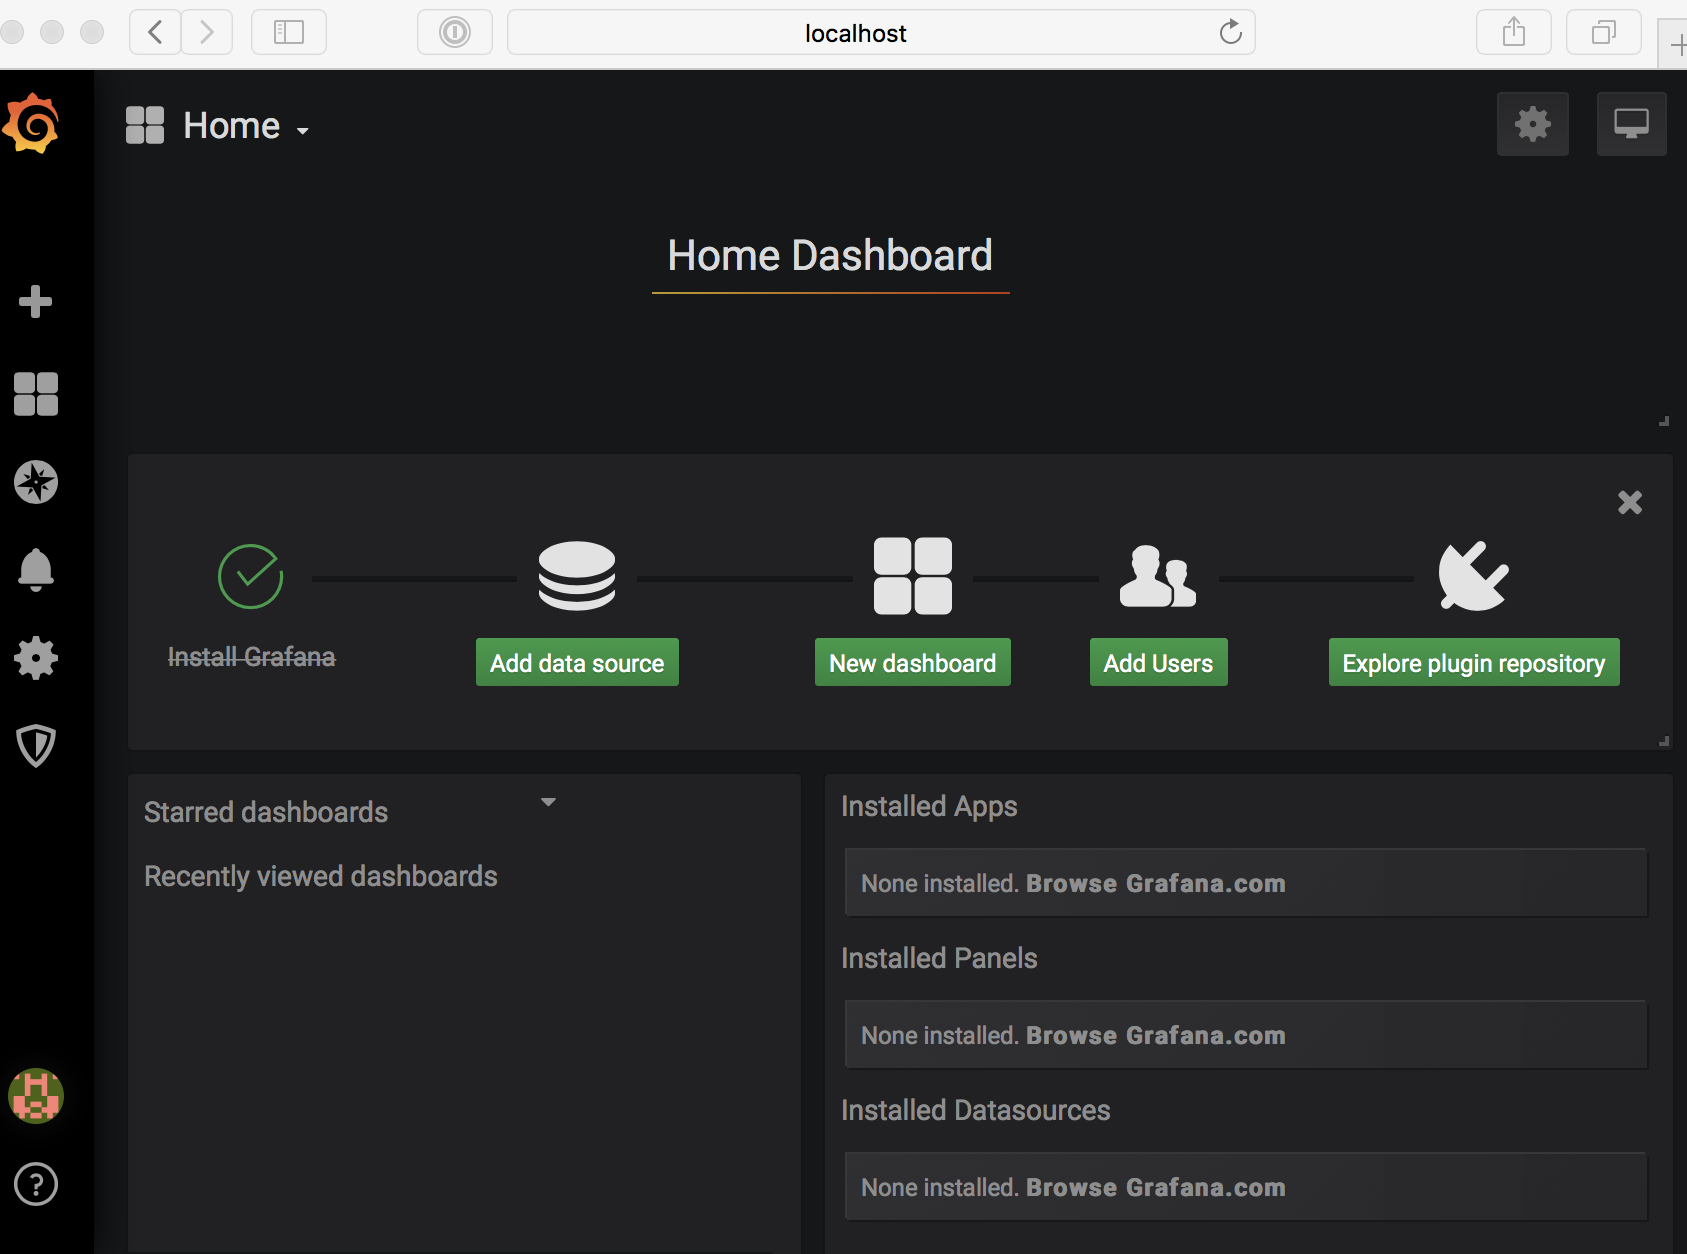
Great job! You've successfully installed and connected your Grafana application.
Summary
Congratulations! You now have a running Grafana server and are ready to take the next steps toward exploring the many powerful features of Grafana. In the upcoming chapters, we'll navigate the interface, analyze data sources, and learn about advanced management practices.


