

Reading data from CSVs and other delimited files
In this recipe, you will use the pandas.read_csv() function, which offers a large set of parameters that you will explore to ensure the data is properly read into a time series DataFrame. In addition, you will learn how to specify an index column, parse the index to be of the type DatetimeIndex, and parse string columns that contain dates into datetime objects.
Generally, using Python, data read from a CSV file will be in string format (text). When using the read_csv method in pandas, it will try and infer the appropriate data types (dtype), and, in most cases, it does a great job at that. However, there are situations where you will need to explicitly indicate which columns to cast to a specific data type. For example, you will specify which column(s) to parse as dates using the parse_dates parameter in this recipe.
Getting ready
You will be reading a CSV file that contains hypothetical box office numbers for a movie. The file is provided in the GitHub repository for this book. The data file is in datasets/Ch2/movieboxoffice.csv.
How to do it…
You will ingest our CSV file using pandas and leverage some of the available parameters in read_csv:
- First, let's load the libraries:
import pandas as pd
from pathlib import Path
- Create a
Pathobject for the file location:filepath =\ Path('../../datasets/Ch2/movieboxoffice.csv') - Read the CSV file into a DataFrame using the
read_csvfunction and passing thefilepathwith additional parameters.
The first column in the CSV file contains movie release dates, and it needs to be set as an index of type DatetimeIndex (index_col=0 and parse_dates=['Date']). Specify which columns you want to include by providing a list of column names to usecols. The default behavior is that the first row includes the header (header=0):
ts = pd.read_csv(filepath,
                 header=0,
                 parse_dates=['Date'],
                 index_col=0,
                 infer_datetime_format=True,
                 usecols=['Date',
                          'DOW',
                          'Daily',
                          'Forecast',
                          'Percent Diff'])
ts.head(5)
This will output the following first five rows:
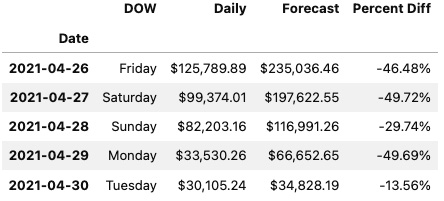
Figure 2.1 – The first five rows of the ts DataFrame using JupyterLab
- Print a summary of the DataFrame to check the index and column data types:
ts.info()
>> <class 'pandas.core.frame.DataFrame'>
DatetimeIndex: 128 entries, 2021-04-26 to 2021-08-31
Data columns (total 4 columns):
 #   Column        Non-Null Count  Dtype
---  ------        --------------  -----
 0   DOW           128 non-null    object
 1   Daily         128 non-null    object
 2   Forecast      128 non-null    object
 3   Percent Diff  128 non-null    object
dtypes: object(4)
memory usage: 5.0+ KB
- Notice that the
Datecolumn is now an index (not a column) of typeDatetimeIndex. Additionally, bothDailyandForecastcolumns have the wrong dtype inference. You would expect them to be of typefloat. The issue is due to the source CSV file containing dollar signs ($) and thousand separators (,) in both columns. The presence of non-numeric characters will cause the columns to be interpreted as strings. A column with thedtypeobject indicates either a string column or a column with mixed dtypes (not homogeneous).
To fix this, you need to remove both the dollar sign ($) and thousand separators (,) or any non-numeric character. You can accomplish this using str.replace(), which can take a regular expression to remove all non-numeric characters but exclude the period (.) for the decimal place. Removing these characters does not convert the dtype, so you will need to cast those two columns as a float dtype using .astype(float):
clean = lambda x: x.str.replace('[^\d]','', regex=True)
c_df = ts[['Daily', 'Forecast']].apply(clean, axis=1)
ts[['Daily', 'Forecast']] = c_df.astype(float)
Print a summary of the updated DataFrame:
ts.info()
>> <class 'pandas.core.frame.DataFrame'>
DatetimeIndex: 128 entries, 2021-04-26 to 2021-08-31
Data columns (total 4 columns):
 #   Column        Non-Null Count  Dtype
---  ------        --------------  -----
 0   DOW           128 non-null    object
 1   Daily         128 non-null    float64
 2   Forecast      128 non-null    float64
 3   Percent Diff  128 non-null    object
dtypes: float64(2), object(2)
memory usage: 5.0+ KB
Now, you have a DataFrame with DatetimeIndex and both Daily and Forecast columns are of dtype float64 (numeric fields).
How it works…
Using pandas for data transformation is fast since it loads the data into memory. For example, the read_csv method reads and loads the entire data into a DataFrame in memory. When requesting a DataFrame summary with the info() method, in addition to column and index data types, the output will display memory usage for the entire DataFrame. To get the exact memory usage for each column, including the index, you can use the memory_usage() method:
ts.memory_usage()
>>
Index           1024
DOW             1024
Daily           1024
Forecast        1024
Percent Diff    1024
dtype: int64
The total will match what was provided in the DataFrame summary:
ts.memory_usage().sum()
>> 5120
So far, you have used a few of the available parameters when reading a CSV file using read_csv. The more familiar you become with the different options available in any of the pandas reader functions, the more upfront preprocessing you can do during data ingestion (reading).
You leveraged the built-in parse_dates argument, which takes in a list of columns (either specified by name or position).The combination of index_col=0 and parse_dates=[0] produced a DataFrame with an index of type DatetimeIndex.
Let's inspect the parameters used in this recipe as defined in the official pandas.read_csv() documentation (https://pandas.pydata.org/pandas-docs/stable/reference/api/pandas.read_csv.html):
filepath_or_buffer: This is the first positional argument and the only required field needed (at a minimum) to read a CSV file. Here, you passed the Python path object namedfilepath. This can also be a string that represents a valid file path such as'../../datasets/Ch2/movieboxoffice.csv'or a URL that points to a remote file location, such as an AWS S3 bucket (we will examine this later in the Reading data from URLs recipe in this chapter).sep: This takes a string to specify which delimiter to use. The default is a comma delimiter (,) which assumes a CSV file. If the file is separated by another delimiter, such as a pipe (|) or semicolon (;), then the argument can be updated, such assep="|" or sep=";".
Another alias to sep is delimiter, which can be used as well as a parameter name.
header: In this case, you specified that the firstrow(0) value contains the header information. The default value isinfer, which usually works as-is in most cases. If the CSV does not contain a header, then you specifyheader=None. If the CSV has a header but you prefer to supply custom column names, then you need to specifyheader=0and overwrite it by providing a list of new column names to thenamesargument.
Recall that you specified which columns to include by passing a list of column names to the usecols parameter. These names are based on the file header (the first row of the CSV file).
If you decide to provide custom header names, you cannot reference the original names in the usecols parameter; this will produce the following error: ValueError: Usecols do not match columns.
parse_dates: In the recipe, you provided a list of column positions using[0], which specified only the first column (by position) should be parsed. Theparse_datesargument can take a list of column names, such as["Date"], or a list of column positions, such as[0, 3], indicating the first and the fourth columns. If you only intend to parse the index column(s) specified in theindex_colparameter, you only need to passTrue(Boolean).index_col: Here, you specified that the first column by position (index_col=0) will be used as the DataFrame index. Alternatively, you could provide the column name as a string (index_col='Date'). The parameter also takes in a list of integers (positional indices) or strings (column names), which would create aMultiIndexobject.usecols: The default value isNone, which includes all the columns in the dataset. Limiting the number of columns to only those that are required results in faster parsing and overall lower memory usage, since you only bring in what is needed. Theusecolsarguments can take a list of column names, such as['Date', 'DOW', 'Daily', 'Percent Diff', 'Forecast']or a list of positional indices, such as[0, 1, 3, 7, 6], which would produce the same result.
There's more…
There are situations where parse_dates may not work (it just cannot parse the date). In such cases, the column(s) will be returned unchanged, and no error will be thrown. This is where the date_parser parameter can be useful.
For example, you can pass a lambda function that uses the to_datetime function in pandas to date_parser. You can specify the string representation for the date format inside to_datetime(), as demonstrated in the following code:
date_parser =lambda x: pd.to_datetime(x, format="%d-%b-%y")
ts = pd.read_csv(filepath,
                 parse_dates=[0],
                 index_col=0,
                 date_parser=date_parser,
                 usecols=[0,1,3, 7, 6])
ts.head()
The preceding code will print out the first five rows of the ts DataFrame displaying a properly parsed Date index.
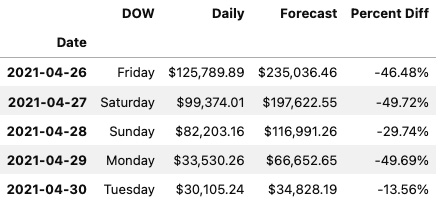
Figure 2.2 – The first five rows of the ts DataFrame using JupyterLab
Let's break it down. In the preceding code, you passed two arguments to the to_datetime function: the object to convert to datetime and an explicit format string. Since the date is stored as a string in the form 26-Apr-21, you passed "%d-%b-%y" to reflect that:
%drepresents the day of the month, such as01or02.%brepresents the abbreviated month name, such asAprorMay.%yrepresents a two-digit year, such as19or20.
Other common string codes include the following:
%Yrepresents the year as a four-digit number, such as2020or2021.%Brepresents the month's full name, such asJanuaryorFebruary.%mrepresents the month as a two-digit number, such as01or02.
For more information on Python's string formats for representing dates, visit https://strftime.org.
See also
According to the pandas documentation, the infer_datetime_format parameter in read_csv() function can speed up the parsing by 5–10x. This is how you can add this to our original script:
ts = pd.read_csv(filepath,
                 header=0,
                 parse_dates=[0],
                 index_col=0,
                 infer_datetime_format= True,
                 usecols=['Date',
                          'DOW',
                          'Daily',
                          'Forecast',
                          'Percent Diff'])
Note that given the dataset is small, the speed improvement may be insignificant.
For more information, please refer to the pandas.read_csv documentation: https://pandas.pydata.org/docs/reference/api/pandas.read_csv.html.