Reader small image

You're reading from  Tableau Desktop Certified Associate: Exam Guide

Product typeBook
Published inDec 2019
PublisherPackt
ISBN-139781838984137
Edition1st Edition
Tools
Right arrow
Authors (5):
Dmitry Anoshin
Dmitry Anoshin
author image
Dmitry Anoshin

Dmitry Anoshin is a data-centric technologist and a recognized expert in building and implementing big data and analytics solutions. He has a successful track record when it comes to implementing business and digital intelligence projects in numerous industries, including retail, finance, marketing, and e-commerce. Dmitry possesses in-depth knowledge of digital/business intelligence, ETL, data warehousing, and big data technologies. He has extensive experience in the data integration process and is proficient in using various data warehousing methodologies. Dmitry has constantly exceeded project expectations when he has worked in the financial, machine tool, and retail industries. He has completed a number of multinational full BI/DI solution life cycle implementation projects. With expertise in data modeling, Dmitry also has a background and business experience in multiple relation databases, OLAP systems, and NoSQL databases. He is also an active speaker at data conferences and helps people to adopt cloud analytics.
Read more about Dmitry Anoshin

JC Gillet
JC Gillet
author image
JC Gillet

Jean-Charles (JC) Gillet is a seasoned business analyst with over 7 years of experience with SQL at both a large-scale multinational company in the United Kingdom and a smaller firm in the United States, and 5 years of Tableau experience. He has been working with Tableau and SQL for multiple years to share his expertise with his colleagues, as well as delivering SQL training. A French national, JC holds a master's degree in executive engineering from Mines ParisTech and is a Tableau Desktop Certified Associate. In his free time, he enjoys spending time with his wife and daughter (to whom he dedicates his work on this book) and playing team handball, having competed in national championships.
Read more about JC Gillet

Fabian Peri
Fabian Peri
author image
Fabian Peri

Fabian Peri's interest in decision analysis started after joining his first fantasy basketball league in 2006. His love for data analysis led him to pursue an MBA in information systems at the University of Tulsa, and then an MSc in predictive analytics from Northwestern University. Since graduating, he has primarily worked in risk analysis and management for companies such as Amazon, GE Capital, and Wells Fargo. He is currently focused on using visualization to explore and interpret vast quantities of data.
Read more about Fabian Peri

Radhika Biyani
Radhika Biyani
author image
Radhika Biyani

Radhika Biyani is currently working as a recruitment insights analyst with Amazon. Before this, she worked as an analytics consultant with Version 1, where she consulted on several large-scale BI and analytics projects with clients across various industry verticals such as HR, finance, utility, supply chain, and more. She holds a master's degree in business analytics and has many certifications, including Tableau Qualified Associate. She enjoys attending meetups and is an active member of many meetup groups, including Tableau User Group Dublin.
Read more about Radhika Biyani

Gleb Makarenko
Gleb Makarenko
author image
Gleb Makarenko

Gleb Makarenko began using Tableau in 2018 and quickly fell in love with how intuitive and easy to use the software was. He was able to easily adapt to its interface and create powerful visualizations. That is when he decided to get certified on Tableau software in order to receive proper credentials that he could use on his resume, as well as learn about the intricacies of the software that he wasn't using at the time. With a bit of effort and research, Gleb was able to complete the examination. And he recommends the same to anyone who is serious about working with Tableau.
Read more about Gleb Makarenko

View More author details
Right arrow

Visualizing Geographic Data

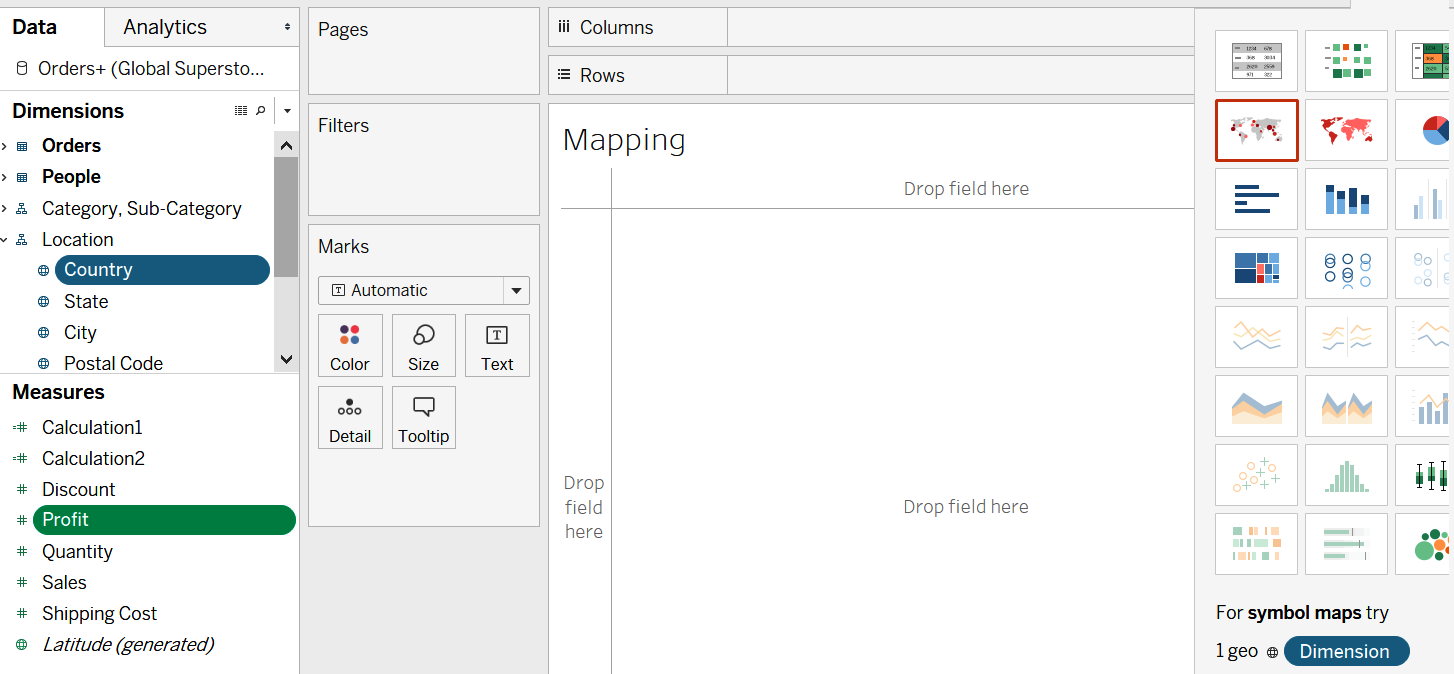
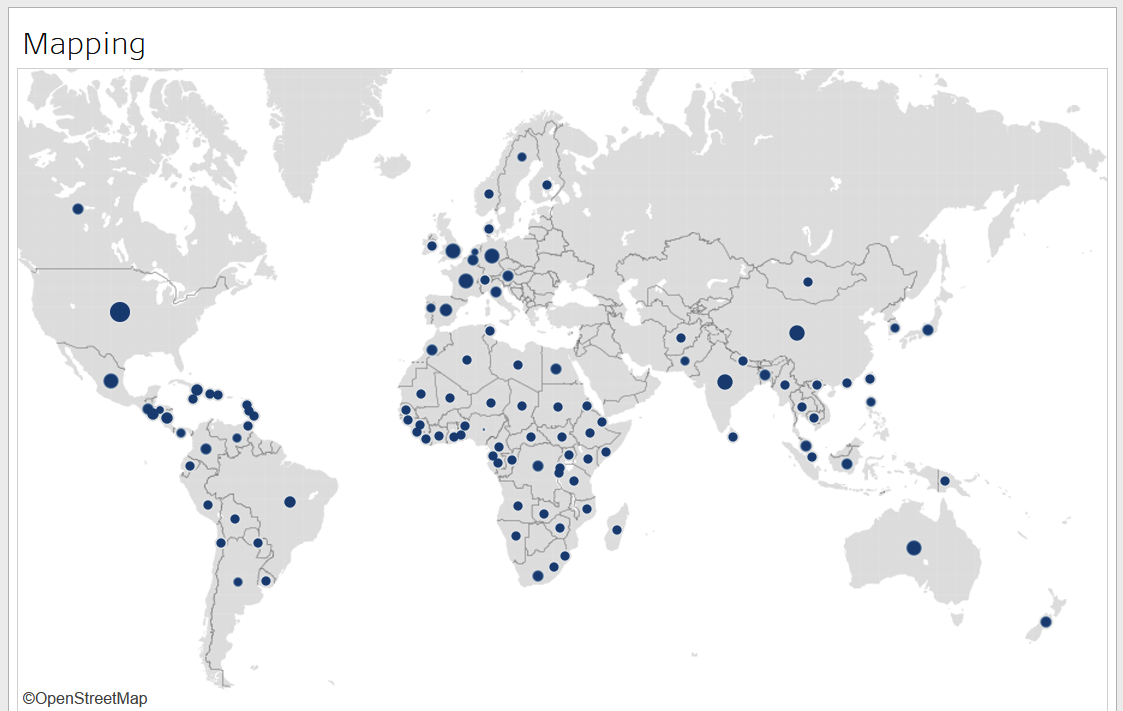
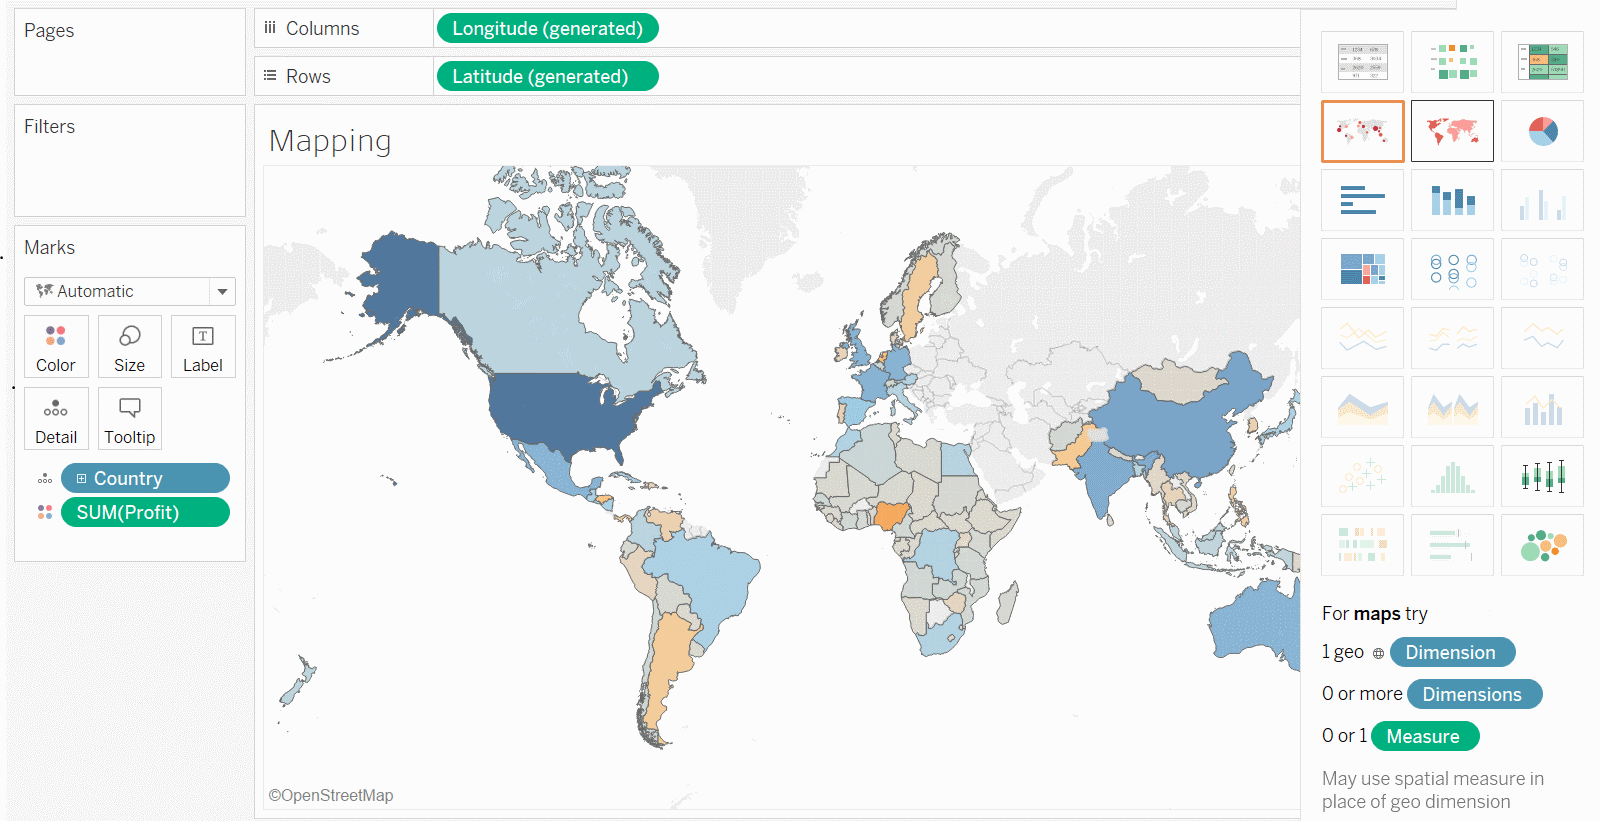
For centuries, maps have been used to convey meaningful data. We are used to seeing maps representing data commonly around us, be it with Google Maps calculating distances, Uber tracking the cost and distance of locations, or weather forecasts looking at each region, and so on. In the last chapter, we learned a bit about the two standard map charts available in the Show Me menu, and how we can use these to visualize geographic data. In this chapter, we will dive deeper into the various mapping capabilities of Tableau and cover the following topics:

  • Mapping basics
  • Map navigation – geographic search, pan and zoom, mark selection, and scaling
  • Map features – layering and custom territories
  • Modifying locations
  • Importing and managing custom geocoding
  • Connecting to spatial data
  • Using the background screenshot map
  • Creating density maps
...

Technical requirements

Mapping basics

Mapping in Tableau is very simple and based on geographic data fields that can be identified by the globe symbol next to them. To create a map, select the geographic fields and any measure, and then click on the Show Me Window. As you can see in the following screenshot, Tableau automatically highlights the symbol map as the preferred visual:

Once you click it, it will create the following screenshot. As you can see, for each country, the symbol marks a point at the geographic center of the location:

Symbol maps always plot marks at the geographic centers and can plot two measures at a time. Filled maps, on the other hand, use geographic locations to define the boundaries within which to fill and can only plot one measure at a time. Using the Show Me menu, if we now switch to filled maps, we can see the following screenshot:

If there are no geographic fields...

Map navigation

When the mouse is anywhere on the map, you will see the Map Options menu appear by default, as shown in the following screenshot:

If you do not see these options, don't worry. On the Menu Bar, click on Map | Map Options and it will show the options to add to the screen. You can see in the following screenshot that we had only the option for Show Map Scale unchecked. Go ahead and check that:

You will notice at the bottom-right of the screen that, the map scale accuracy has appeared. The more you zoom into the map, the more your accuracy will increase. Having the distances scale easily allows us to look at distances in miles, kilometers, or any of your preferred units:

Now, let's look at each of the features in detail.

Pan and zoom

...

Map features – layering and custom territories

Now that we have learned how to create maps, let's look at how we can customize certain map details, such as the color of the map, what level of details it will display, and the territories shown within it.

Map Layers

To view the layers that can be added or removed from the map or how it will look in the background, select Map | Map Layers. In previous versions of Tableau, you would select Map | Map Options. You will get the following screen:

Here, you can select and change between the different backgrounds: Normal, Light, and Dark. Depending on the Tableau version, you may also have Street, Outdoors, and Satellite Backgrounds available:

As shown in the following...

Modifying locations

Once you define a field as a geographic field, Tableau automatically detects the locations of the places. Sometimes, however, Tableau will show x Unknowns in the right-hand corner of the screen. This could be because the location can be ambiguous, that is, multiple places having the same name, or the spelling could differ from what Tableau recognizes, for example.

The easiest way to fix most errors is to bring other data fields into the map details as well. For example, if you are only plotting cities, many countries can have the same city names. Adding a country and state can help to rectify such errors. If there is a hierarchy of locations, then Tableau automatically uses it to remove ambiguities. If, after doing this, there are still errors remaining, you can custom edit the locations to make them match.

...

Importing and managing custom geocoding

Beyond providing standard geocoding for geolocations such as City, State, Country, Country/Region, Zip Code, Postal Code, and County, Tableau also allows us to custom import their own geocoded files. Custom geocoded files are useful if we have locations that Tableau can't map, for example, a street address, or if there is a custom geographic field that we want to define, and so on.

To create a custom geocoding, we need a .csv file to import into Tableau. This file must contain Latitude and Longitude columns as real numbers, with at least one decimal point in them. Other than these two columns, the other columns will depend on whether we are extending an existing role or adding a new role.

Extending an existing role

...

Connecting to spatial data

We can connect to, and import spatial data from, TopoJSON files, Shapefiles, MapInfo tables, GeoJSON files, KML files, and Esri File Geodatabases. Using these files, we can connect to point, linear, and polygon geometries. Currently, mixed geometries are not allowed in Tableau.

Each of the file sources listed earlier has certain restrictions on what the folder containing these files must include. These are listed in the following table:

File Source

Files Required in Folder

Esri Shapefiles

.shp, .shx, .dbf , .prj, and .zip

Esri Geodatabases

Either .zip containing .gdb or a .gdb file

KML files

.kml

TopoJSON

.topojson or .json

GeoJSON

.geojson

MapInfo

.MAP, .DAT, .TAB, and .MID, or a .MIF, or .ID file

For an example of how to create maps using shapefiles, we will use the file downloaded for London Wards as...

Using background images to plot spatial data

There may be situations when spatial data is not enough to accurately plot data on the map. In such cases, we can also use background images as a background. While this option allows for the most flexibility in how to plot, it also requires the most effort in defining the boundary and point coordinates.

For example, say you wanted to plot the house plan of your house and have the following data:

Location

Location ID

X

Y

Size

Room 3

1

15

20

100

Room 1

2

15

50

100

Room 4

3

40

20

125

Room 5

4

40

50

125

Porch

5

60

40

60

You also have this screenshot:

We add the screenshot data as the data source. To test how the appropriate positions would look, create a scatter plot with unaggregated measures. For the preceding example, plotting the X and Y values, we get the...

Creating density maps

Density marks were added to Tableau in version 2018.3. These marks add another way of finding patterns in areas where there is a lot of overlapping data or the concentration of data is very high. Density marks find their best use in creating density maps, making it super easy to find trends in spatial data. Density maps work best with custom geocoded files, as they allow for detailed granular data to be added. Granular and precise data in a small range, along with smooth changes in measure values is the ideal use case for using density maps.

For this example, we will be using the 311 calls dataset. In case you have not yet downloaded it, download it here in a .csv format: https://data.nola.gov/City-Administration/311-Calls-Historic-Data-2012-2018-/3iz8-nghx.

Now, if we want to understand the distribution of calls by Zip Code for LA, and decide to plot a...

Summary

In this chapter, we detailed how to create, navigate, and customize maps. We learned how to identify the correct locations for mapping, enhance geocoding, and create our own custom geocoding and geographic fields. Furthermore, we covered spatial files, and how they can be leveraged to create nuanced maps for specific purposes. We also looked at adding background images to maps, creating custom maps, and creating density maps.

All of this will give you a firm understanding of the extent of customization you can achieve with maps and how they can be a powerful analysis tool. In the next chapter, we will start by creating simple calculations that can be leveraged across the various visuals we have learned about in this chapter and the last.

lock icon
The rest of the chapter is locked
You have been reading a chapter from
Tableau Desktop Certified Associate: Exam Guide
Published in: Dec 2019Publisher: PacktISBN-13: 9781838984137
Register for a free Packt account to unlock a world of extra content!
A free Packt account unlocks extra newsletters, articles, discounted offers, and much more. Start advancing your knowledge today.
undefined
Unlock this book and the full library FREE for 7 days
Get unlimited access to 7000+ expert-authored eBooks and videos courses covering every tech area you can think of
Renews at $15.99/month. Cancel anytime

Authors (5)

author image
Dmitry Anoshin

Dmitry Anoshin is a data-centric technologist and a recognized expert in building and implementing big data and analytics solutions. He has a successful track record when it comes to implementing business and digital intelligence projects in numerous industries, including retail, finance, marketing, and e-commerce. Dmitry possesses in-depth knowledge of digital/business intelligence, ETL, data warehousing, and big data technologies. He has extensive experience in the data integration process and is proficient in using various data warehousing methodologies. Dmitry has constantly exceeded project expectations when he has worked in the financial, machine tool, and retail industries. He has completed a number of multinational full BI/DI solution life cycle implementation projects. With expertise in data modeling, Dmitry also has a background and business experience in multiple relation databases, OLAP systems, and NoSQL databases. He is also an active speaker at data conferences and helps people to adopt cloud analytics.
Read more about Dmitry Anoshin

author image
JC Gillet

Jean-Charles (JC) Gillet is a seasoned business analyst with over 7 years of experience with SQL at both a large-scale multinational company in the United Kingdom and a smaller firm in the United States, and 5 years of Tableau experience. He has been working with Tableau and SQL for multiple years to share his expertise with his colleagues, as well as delivering SQL training. A French national, JC holds a master's degree in executive engineering from Mines ParisTech and is a Tableau Desktop Certified Associate. In his free time, he enjoys spending time with his wife and daughter (to whom he dedicates his work on this book) and playing team handball, having competed in national championships.
Read more about JC Gillet

author image
Fabian Peri

Fabian Peri's interest in decision analysis started after joining his first fantasy basketball league in 2006. His love for data analysis led him to pursue an MBA in information systems at the University of Tulsa, and then an MSc in predictive analytics from Northwestern University. Since graduating, he has primarily worked in risk analysis and management for companies such as Amazon, GE Capital, and Wells Fargo. He is currently focused on using visualization to explore and interpret vast quantities of data.
Read more about Fabian Peri

author image
Radhika Biyani

Radhika Biyani is currently working as a recruitment insights analyst with Amazon. Before this, she worked as an analytics consultant with Version 1, where she consulted on several large-scale BI and analytics projects with clients across various industry verticals such as HR, finance, utility, supply chain, and more. She holds a master's degree in business analytics and has many certifications, including Tableau Qualified Associate. She enjoys attending meetups and is an active member of many meetup groups, including Tableau User Group Dublin.
Read more about Radhika Biyani

author image
Gleb Makarenko

Gleb Makarenko began using Tableau in 2018 and quickly fell in love with how intuitive and easy to use the software was. He was able to easily adapt to its interface and create powerful visualizations. That is when he decided to get certified on Tableau software in order to receive proper credentials that he could use on his resume, as well as learn about the intricacies of the software that he wasn't using at the time. With a bit of effort and research, Gleb was able to complete the examination. And he recommends the same to anyone who is serious about working with Tableau.
Read more about Gleb Makarenko