Search icon
Arrow left icon
All Products
Best Sellers
New Releases
Books
Videos
Audiobooks
Learning Hub
Newsletters
Free Learning
Arrow right icon
Mastering pandas. - Second Edition

You're reading from  Mastering pandas. - Second Edition

Product type Book
Published in Oct 2019
Publisher
ISBN-13 9781789343236
Pages 674 pages
Edition 2nd Edition
Languages
Author (1):
Ashish Kumar Ashish Kumar
Profile icon Ashish Kumar

Table of Contents (21) Chapters

Preface Section 1: Overview of Data Analysis and pandas
Introduction to pandas and Data Analysis Installation of pandas and Supporting Software Section 2: Data Structures and I/O in pandas
Using NumPy and Data Structures with pandas I/Os of Different Data Formats with pandas Section 3: Mastering Different Data Operations in pandas
Indexing and Selecting in pandas Grouping, Merging, and Reshaping Data in pandas Special Data Operations in pandas Time Series and Plotting Using Matplotlib Section 4: Going a Step Beyond with pandas
Making Powerful Reports In Jupyter Using pandas A Tour of Statistics with pandas and NumPy A Brief Tour of Bayesian Statistics and Maximum Likelihood Estimates Data Case Studies Using pandas The pandas Library Architecture pandas Compared with Other Tools A Brief Tour of Machine Learning Other Books You May Enjoy

I/Os of Different Data Formats with pandas

A data scientist has to work on data that comes from a variety of sources and hence in a variety of formats. The most common are the ubiquitous spreadsheets, Excel sheets, and CSV and text files. But there are many others, such as URL, API, JSON, XML, HDF, Feather and so on, depending on where it is being accessed. In this chapter, we will cover the following topics among others:

  • Data sources and pandas methods
  • CSV and TXT
  • URL and S3
  • JSON
  • Reading HDF formats

Let's get started!

Data sources and pandas methods

The data sources for a data science project can be clubbed into the following categories:

  • Databases: Most of the CRM, ERP, and other business operations tools store data in a database. Depending on the volume, velocity, and variety, it can be a traditional or NoSQL database. To connect to most of the popular databases, we need JDBC/ODBC drivers from Python. Fortunately, there are such drivers available for all the popular databases. Working with data in such databases involves making a connection through Python to these databases, querying the data through Python, and then manipulating it using pandas. We will look at an example of how to do this later in this chapter.
  • Web services: Many of the business operations tools, especially Software as a Services (SaaS) tools, make their data accessible through Application Programming Interfaces (APIs)...

CSV and TXT

CSV stands for comma-separated values, which means that the comma is the default delimiter for these files. However, they accept other delimiters as well.

CSVs are made of columns and rows and the cell value is arranged in a tabular format. They can come with or without column names and row indices. The primary reasons for a CSV file's existence include manually gathered data, data that's been extracted and downloaded from a database, a direct download from a tool or website, web scraping, and the result of running a data science algorithm.

Reading CSV and TXT files

read_csv is the go-to method for reading CSV files in pandas. It can also be used to read txt files. The syntax of using read_csv is shown...

Excel

Excel files are similar to CSV files but are different in the sense that they can have multiple sheets, formatted data and tables, charts, and formulas. In many cases, reading data from Excel files is required.

xlrd is the package of choice while working with Excel sheets. Some of the major functionalities of the xlrd package are summarized in the following table:

Code snippet

Goal achieved

import xlrd

Importing the xlrd library

book=xlrd.open_workbook('SRS Career.xlsx')

Reading the Excel workbook

n=book.nsheets

Finding the number of sheets in a workbook

book.sheet_names()

Finding the names of sheets in a workbook

last_sheet=book.sheet_by_index(n-1)

Reading the sheets by sheet index

last_sheet.row_values(0)

Getting the first row of a sheet

last_sheet.cell(0,0)

Getting the first cell of the sheet

last_sheet.row_slice...

URL and S3

Sometimes, the data is directly available as a URL. In such cases, read_csv can be directly used to read from these URLs:

pd.read_csv('http://bit.ly/2cLzoxH').head()

Alternatively, to work with URLs in order to get data, we can use a couple of Python packages that we haven't used so far, such as .csv and .urllib. It would suffice to know that .csv provides a range of methods for handling .csv files and that urllib is used to navigate to and access information from the URL. Here is how we can do this:

import csv 
import urllib2 
 
url='http://archive.ics.uci.edu/ml/machine-learning-databases/iris/iris.data' 
response=urllib2.urlopen(url) 
cr=csv.reader(response) 
 
for rows in cr: 
   print rows 
 

AWS S3 is a popular file-sharing and storage repository on the web. Many enterprises store their business operations data as files on S3, which needs...

HTML

HTML is the popular file format for creating and wrapping web elements and pages. Sometimes, tabular data is stored in a file. In such cases, the read_html method is directly used to read such data. This function parses table elements from HTML files and reads the tables as DataFrames:

pd.read_html('http://www.fdic.gov/bank/individual/failed/banklist.html') 

You can find all of the table elements containing a particular match word by using the following code:

 match = 'Malta National Bank' 
df_list = pd.read_html('http://www.fdic.gov/bank/individual/failed/banklist.html', match=match) 

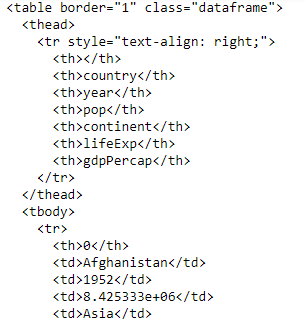
A DataFrame can be converted into an HTML table element so that it can be placed into an HTML file like so:

data=pd.read_csv('http://bit.ly/2cLzoxH')
print(data.to_html())

We get the following output:

HTML table element created from a DataFrame

A selected...

JSON

JSON is a popular dictionary-like, key-value pair-based data structure that's suitable for exposing data as APIs from SaaS tools. address, postalCode, state, streetAddress, age, firstName, lastName, and phoneNumber are keys whose values are shown to the right of them. JSON files can be nested (the values of a key are JSON) as well. Here, address has nested values:

Example of JSON data (dictionary; key-value pairs)

DataFrames can be converted into JSON using to_json:

import numpy as np 
pd.DataFrame(np.random.randn(5, 2), columns=list('AB')).to_json() "

Take a look at the following screenshot:

Converting a DataFrame into JSON format

While converting the DataFrame into a JSON file, the orientation can be set.

If we want to keep the column name as the primary index and the row indices as the secondary index, then we can choose the orientation to be columns...

Reading HDF formats

The Hierarchical Data Format (HDF) is efficient in handling large and complex data models. The versatility and flexibility of HDF in data storage make it a sought after format for storing scientific data. In fact, HDF was selected as the standard data and information system by NASA, for use in the Earth Observing System. HDF5 is the current technological suite used by the HDF file format and replaced the older HDF4.

The following are some unique features of HDF5:

  • HDF5 has no set limits regarding file size and the objects in the file.
  • HDF5 can group and link objects in the file, thereby facilitating as a supportive mechanism for complex relationships and dependencies in data.
  • HDF5 also supports metadata.
  • While accommodating a variety of predefined and user-defined data types, HDF5 also has the ability to store and share data type descriptions in HDF files.
  • ...

Reading feather files

The feather format is a binary file format for storing data that makes use of Apache Arrow, an in-memory columnar data structure. It was developed by Wes Mckinney and Hadley Wickham, chief scientists at RStudio as an initiative for a data sharing infrastructure across Python and R. The columnar serialization of data in feather files makes way for efficient read and write operations, making it far faster than CSV and JSON files where storage is record-wise.

Feather files have the following features:

  • Fast I/O operations.
  • Feather files can be read and written in languages other than R or Python, such as Julia and Scala.
  • They have compatibility with all pandas datatypes, such as Datetime and Categorical.

Feather currently supports the following datatypes:

  • All numeric datatypes
  • Logical
  • Timestamps
  • Categorical
  • UTF-8 encoded strings
  • Binary

Since feather is merely...

Reading parquet files

Apache Parquet is another file format that makes use of columnar compression for efficient read and write operations. It was designed to be compatible with big data ecosystems such as Hadoop and can handle nested data structures and sparsely populated columns. Though the parquet and feather formats share a similar base, parquet has a better compression routine than feather. The compressed file is smaller in parquet than it is in feather. Columns with similar data types use the same encoding for compression. The use of different encoding schemes for the compression of parquet makes it efficient. Just like feather, parquet is a binary file format that can work well with all pandas data types and is supported across several languages. Parquet can be used for the long-term storage of data.

The following are some limitations of the parquet file format:

  • While...

Reading a SQL file

Interacting with a SQL database through pandas requires the sqlalchemy dependency to be installed.

First, let's define the engine from which connection parameters can be obtained:

engine = create_engine('sqlite:///:memory:')

Now, let's read the data_sql table from the SQL database:

with engine.connect() as conn, conn.begin():
print(pd.read_sql_table('data_sql', conn))

This results in the following output:

Output of read_sql_table

The read_sql_table() function reads an entire table for the given table name. A specific column can be set as the index when reading:

pd.read_sql_table('data_sql', engine, index_col='index')

This results in the following output:

Output of read_sql_table with indexing

The columns argument lets us choose specific columns when reading data by passing the column names as a list. Any...

Reading a SAS/Stata file

Pandas can read two file formats from SAS SAS xports (.XPT) and SAS data files (.sas7bdat).

The read_sas() function helps read SAS files. Here, a SAS data file has been read and displayed as a pandas dataframe:

df = pd.read_sas('sample.sas7bdat')
df

This results in the following output:

Output of read_sas

The chunksize and iterator arguments help in reading the SAS file in groups of the same size. If the SAS data file that was used earlier is read with a chunksize of 10, then the 51 records will be divided into six groups, as shown in the following code:

rdr = pd.read_sas('sample.sas7bdat', chunksize=10)
for chunk in rdr:
print(chunk.shape)

Take a look at the following output:

Output of read_sas with chunksize

However, these SAS files cannot be written using pandas.

Pandas also provides support for reading and writing files...

Reading from Google BigQuery

BigQuery is an extremely powerful data warehousing solution provided by Google. Pandas can directly connect to BigQuery and bring your data to a Python environment for further analysis.

The following is an example of reading a dataset from BigQuery:

pd.read_gbq("SELECT urban_area_code, geo_code, name, area_type, area_land_meters 
FROM `bigquery-public-data.utility_us.us_cities_area` LIMIT 5", project_id, dialect = "standard")

Take a look at the following output:

Output of read_gbq

The read_gbq() function accepts the query and the Google Cloud project-id (which serves as a key) so that it can access the database and bring out the data. The dialect argument takes care of the SQL syntax to be used: BigQuery's legacy SQL dialect or the standard SQL dialect. In addition, there are arguments that allow the index column to be set...

Reading from a clipboard

This is a rather interesting feature in pandas. Any tabular data that has been copied onto the clipboard can be read as a DataFrame in pandas.

Let's copy the following tabular data with the usual ctrl + C keyboard command:

Gender

Entry_Date

Flag

A

M

2012-01-19

True

B

F

2012-12-30

False

C

M

2012-05-05

False

Calling the read_clipboard() function makes this data available as a pandas DataFrame:

pd.read_clipboard()

Take a look at the following output:

Output of read_clipboard

This function also recognizes the Flag column as a bool data type by default and assigns the unnamed column to be the index:

Data types after reading the clipboard

Managing sparse data

Sparse data refers to data structures such as arrays, series, DataFrames, and panels in which there is a very high proportion of missing data or NaNs.

Let's create a sparse DataFrame:

df = pd.DataFrame(np.random.randn(100, 3))
df.iloc[:95] = np.nan

This DataFrame has NaNs in 95% of the records. The memory usage of this data can be estimated with the following code:

df.memory_usage()

Take a look at the following output:

Memory usage of a DataFrame with 95% NaNs

As we can see, each element consumes 8 bytes of data, irrespective of whether it is actual data or a NaN. Pandas offers a memory-efficient solution for handling sparse data, as depicted in the following code:

sparse_df = df.to_sparse()
sparse_df.memory_usage()

Take a look at the following output:

Memory usage of sparse data

Now, the memory usage has come down, with memory not being allotted to...

Writing JSON objects to a file

The to_json() function allows any DataFrame object to be converted into a JSON string or written to a JSON file if the file path is specified:

df = pd.DataFrame({"Col1": [1, 2, 3, 4, 5], "Col2": ["A", "B", "B", "A", "C"], "Col3": [True, False, False, True, True]})
df.to_json()

Take a look at the following output:

JSON output

The orientation of the data in the JSON can be altered. The to_json() function has an orient argument which can be set for the following modes: columns, index, record, value, and split. Columns is the default setting for orientation:

df.to_json(orient="columns")

Take a look at the following output:

JSON output column orientation

Orienting along the index acts like a transpose of the former case with a reversal of row and column...

Serialization/deserialization

Serialization is the process of translating data structures or object state into a format that can be stored (for example, in a file or memory buffer) or transmitted (for example, across a network connection link) and reconstructed later (possibly in a different computer environment).[1] When the resulting series of bits is reread according to the serialization format, it can be used to create a semantically identical clone of the original object.

Data structures such as JSON, arrays, DataFrames, and Series sometimes need to be stored as physical files or transmitted over a network. These serializations can be understood as a dump of data where data can be stored in any format (text, CSV, and so on) or structure but all the important data points can be recreated by loading/deserializing them.

Some examples of this are storing the parameters of the...

Writing to exotic file types

There are various formats that a data structure or object can be stored in. Let's go over a few of them.

to_pickle()

When a Python object is pickled, it gets saved to disk. Pickling serializes the object first, before writing it. It involves converting objects such as lists, Dicts, DataFrames, and trained machine learning models into a character stream.

Let's convert the DataFrame we defined earlier into pickle format:

df.to_pickle('pickle_filename.pkl')

It is also possible to compress pickle files before they are written. Compression schemes such as gzip, bz2, and xz are supported:

df.to_pickle("pickle_filename.compress", compression="gzip")

By default...

GeoPandas

GeoPandas is a Python package written on top of pandas that's used to work with geospatial data. It is designed to work with existing tools, such as desktop GIS, geospatial databases, web maps, and Python data tools.

GeoPandas allows you to easily perform operations in Python that would otherwise require a spatial database such as PostGIS.

What is geospatial data?

Spatial data, geospatial data, GIS data, and geodata are the names for numeric data that identifies the geographical location of a physical object such as a building, street, town, city, country, and so on according to a geographic coordinate system. Apart from the geographical location, geospatial data often also stores socioeconomic data, transaction...

Open source APIs – Quandl

Python can be used to fetch data from open source and commercial APIs. We can use it to fetch data in several formats. Some of them output data in JSON format, some in XML, and some in tabular formats such as CSV and DataFrames. Once converted into DataFrames, this data is generally processed in pandas.

In this section, we will look at an example of fetching data from the Quandl API, which is an open source API that contains data on a variety of topics such as financial, economic, and alternative data. You can have a look at this famous data repository here: https://www.quandl.com/.

An api key is an application programming interface that acts as a mediator between a developer or any other user who wishes to access the data within the website using a computer code. An api key is a piece of code that identifies the user and their associated account...

Pandas plotting

A picture is worth a thousand words. This is why graphs are commonly used to visually illustrate relationships in data. The purpose of a graph is to present data that is too numerous or complicated to be described adequately in terms of text and in less space. With Python's plotting function, it takes far less than a few words of code to create a production-quality graphic.

We will begin by installing the necessary packages:

import pandas as pd 
import numpy as np 

We are using the mtcars data here to explain the plots:

mtcars = pd.DataFrame({ 
        'mpg':[21,21,22.8,21.4,18.7,18.1,18.3,24.4,22.8,19.2], 
        'cyl':[6,6,4,6,8,6,8,4,4,4], 
        'disp':[160,160,108,258,360,225,360,146.7,140.8,167.7], 
  'hp':[110,110,93,110,175,105,245,62,95,123],    
'category':['SUV','Sedan',&apos...

pandas-datareader

We can use pandas to not only read data from local CSV or text files but also from various popular remote data sources such as Yahoo Finance, World Bank, and so on. Without any support from pandas, this would have been tedious and we would have to resort to web scraping. This simple and powerful functionality is provided through the pandas-datareader.

It provides us with a direct way of connecting through various data sources from the comfort of the pandas ecosystem without having to delve into the complexity of HTML/JavaScript code where data is enmeshed. These data sources can be accessed by providing the source name and data code. Only a subset of the data can be obtained.

Let's delve deeper and see how we can use it:

  1. Install pandas-datareader through pip using the following command:
pip install pandas-datareader  

You can also install it through conda...

Summary

After reading this chapter, the following points have been observed:

  • pandas provides powerful methods so that we can read from and write to a variety of data structures and a variety of sources.
  • The read_csv method in pandas can be used for reading CSV files, TXT files, and tables. This method has a multitude of arguments in order to specify delimiters, which rows to skip while reading, reading a file in smaller chunks, and so on.
  • pandas can be used to read data directly from URLs or S3.
  • DataFrames can be converted into JSON and vice versa. JSON can be stored in text files that can be read.
  • JSONs have dictionary-like structures that can be nested an infinite number of times. This nested data can be subsetted just like a dictionary with keys.
  • Pandas provide methods so that we can read data from the HD5, HTML, SAS, SQL, parquet, feather, and Google BigQuery data formats...
lock icon The rest of the chapter is locked
You have been reading a chapter from
Mastering pandas. - Second Edition
Published in: Oct 2019 Publisher: ISBN-13: 9781789343236
Register for a free Packt account to unlock a world of extra content!
A free Packt account unlocks extra newsletters, articles, discounted offers, and much more. Start advancing your knowledge today.
Unlock this book and the full library FREE for 7 days
Get unlimited access to 7000+ expert-authored eBooks and videos courses covering every tech area you can think of
Renews at $15.99/month. Cancel anytime}