Reader small image

You're reading from  Learning PySpark

Product typeBook
Published inFeb 2017
Reading LevelIntermediate
PublisherPackt
ISBN-139781786463708
Edition1st Edition
Languages
Right arrow
Authors (2):
Tomasz Drabas
Tomasz Drabas
author image
Tomasz Drabas

Tomasz Drabas is a Data Scientist working for Microsoft and currently residing in the Seattle area. He has over 12 years' international experience in data analytics and data science in numerous fields: advanced technology, airlines, telecommunications, finance, and consulting. Tomasz started his career in 2003 with LOT Polish Airlines in Warsaw, Poland while finishing his Master's degree in strategy management. In 2007, he moved to Sydney to pursue a doctoral degree in operations research at the University of New South Wales, School of Aviation; his research crossed boundaries between discrete choice modeling and airline operations research. During his time in Sydney, he worked as a Data Analyst for Beyond Analysis Australia and as a Senior Data Analyst/Data Scientist for Vodafone Hutchison Australia among others. He has also published scientific papers, attended international conferences, and served as a reviewer for scientific journals. In 2015 he relocated to Seattle to begin his work for Microsoft. While there, he has worked on numerous projects involving solving problems in high-dimensional feature space.
Read more about Tomasz Drabas

Denny Lee
Denny Lee
author image
Denny Lee

Denny Lee is a Principal Program Manager at Microsoft for the Azure DocumentDB teamMicrosoft's blazing fast, planet-scale managed document store service. He is a hands-on distributed systems and data science engineer with more than 18 years of experience developing Internet-scale infrastructure, data platforms, and predictive analytics systems for both on-premise and cloud environments. He has extensive experience of building greenfield teams as well as turnaround/ change catalyst. Prior to joining the Azure DocumentDB team, Denny worked as a Technology Evangelist at Databricks; he has been working with Apache Spark since 0.5. He was also the Senior Director of Data Sciences Engineering at Concur, and was on the incubation team that built Microsoft's Hadoop on Windows and Azure service (currently known as HDInsight). Denny also has a Masters in Biomedical Informatics from Oregon Health and Sciences University and has architected and implemented powerful data solutions for enterprise healthcare customers for the last 15 years.
Read more about Denny Lee

View More author details
Right arrow

Chapter 3. DataFrames

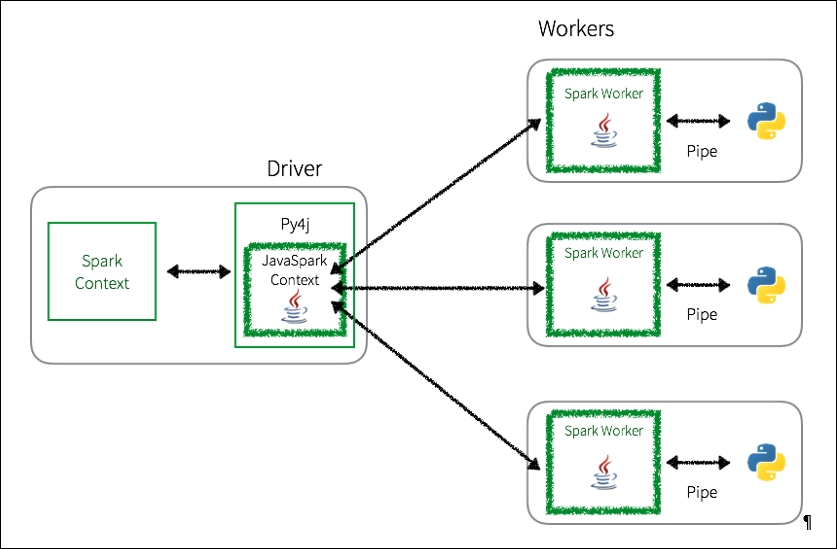
A DataFrame is an immutable distributed collection of data that is organized into named columns analogous to a table in a relational database. Introduced as an experimental feature within Apache Spark 1.0 as SchemaRDD, they were renamed to DataFrames as part of the Apache Spark 1.3 release. For readers who are familiar with Python Pandas DataFrame or R DataFrame, a Spark DataFrame is a similar concept in that it allows users to easily work with structured data (for example, data tables); there are some differences as well so please temper your expectations.

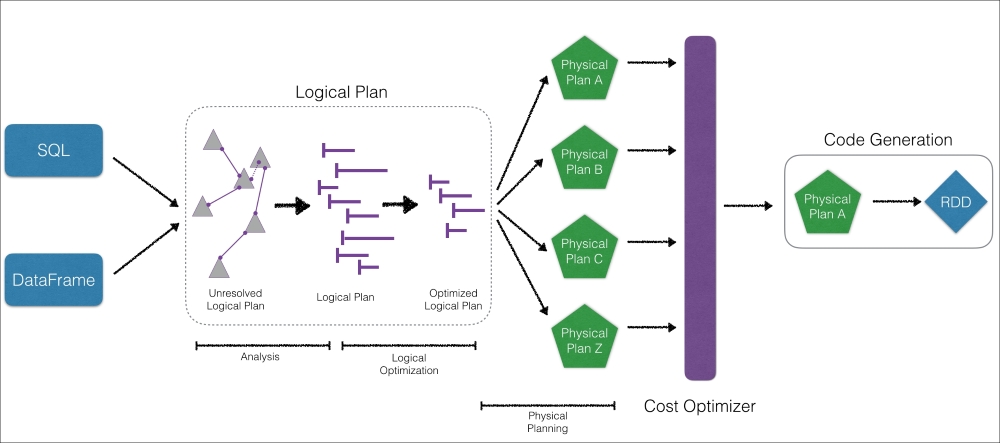
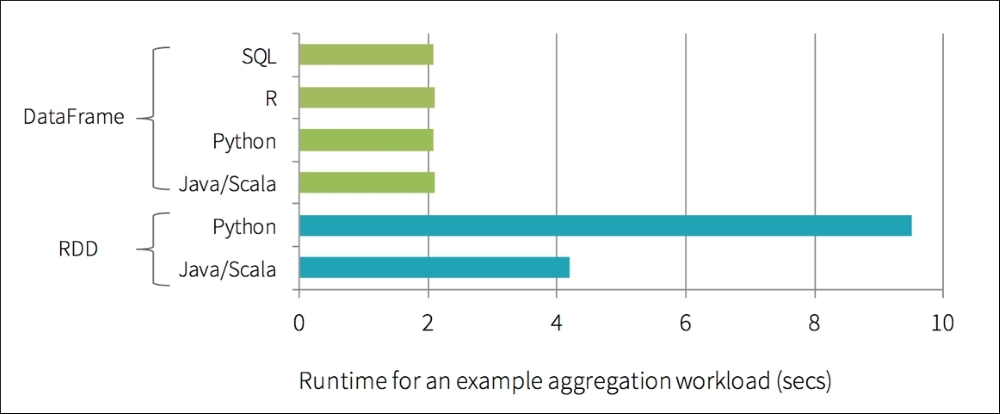
By imposing a structure onto a distributed collection of data, this allows Spark users to query structured data in Spark SQL or using expression methods (instead of lambdas). In this chapter, we will include code samples using both methods. By structuring your data, this allows the Apache Spark engine – specifically, the Catalyst Optimizer – to significantly improve the performance of Spark queries. In earlier APIs...

Python to RDD communications


Whenever a PySpark program is executed using RDDs, there is a potentially large overhead to execute the job. As noted in the following diagram, in the PySpark driver, the Spark Context uses Py4j to launch a JVM using the JavaSparkContext. Any RDD transformations are initially mapped to PythonRDD objects in Java.

Once these tasks are pushed out to the Spark Worker(s), PythonRDD objects launch Python subprocesses using pipes to send both code and data to be processed within Python:

While this approach allows PySpark to distribute the processing of the data to multiple Python subprocesses on multiple workers, as you can see, there is a lot of context switching and communications overhead between Python and the JVM.

Note

An excellent resource on PySpark performance is Holden Karau's Improving PySpark Performance: Spark performance beyond the JVM: http://bit.ly/2bx89bn.

Catalyst Optimizer refresh


As noted in Chapter 1, Understanding Spark, one of the primary reasons the Spark SQL engine is so fast is because of the Catalyst Optimizer. For readers with a database background, this diagram looks similar to the logical/physical planner and cost model/cost-based optimization of a relational database management system (RDBMS):

The significance of this is that, as opposed to immediately processing the query, the Spark engine's Catalyst Optimizer compiles and optimizes a logical plan and has a cost optimizer that determines the most efficient physical plan generated.

Note

As noted in earlier chapters, while the Spark SQL Engine has both rules-based and cost-based optimizations that include (but are not limited to) predicate push down and column pruning. Targeted for the Apache Spark 2.2 release, the jira item [SPARK-16026] Cost-based Optimizer Framework at https://issues.apache.org/jira/browse/SPARK-16026 is an umbrella ticket to implement a cost-based optimizer framework...

Speeding up PySpark with DataFrames


The significance of DataFrames and the Catalyst Optimizer (and Project Tungsten) is the increase in performance of PySpark queries when compared to non-optimized RDD queries. As shown in the following figure, prior to the introduction of DataFrames, Python query speeds were often twice as slow as the same Scala queries using RDD. Typically, this slowdown in query performance was due to the communications overhead between Python and the JVM:

Source: Introducing DataFrames in Apache-spark for Large Scale Data Science at http://bit.ly/2blDBI1

With DataFrames, not only was there a significant improvement in Python performance, there is now performance parity between Python, Scala, SQL, and R.

Tip

It is important to note that while, with DataFrames, PySpark is often significantly faster, there are some exceptions. The most prominent one is the use of Python UDFs, which results in round-trip communication between Python and the JVM. Note, this would be the worst...

Creating DataFrames


Typically, you will create DataFrames by importing data using SparkSession (or calling spark in the PySpark shell).

Tip

In Spark 1.x versions, you typically had to use sqlContext.

In future chapters, we will discuss how to import data into your local file system, Hadoop Distributed File System (HDFS), or other cloud storage systems (for example, S3 or WASB). For this chapter, we will focus on generating your own DataFrame data directly within Spark or utilizing the data sources already available within Databricks Community Edition.

Note

For instructions on how to sign up for the Community Edition of Databricks, see the bonus chapter, Free Spark Cloud Offering.

First, instead of accessing the file system, we will create a DataFrame by generating the data. In this case, we'll first create the stringJSONRDD RDD and then convert it into a DataFrame. This code snippet creates an RDD comprised of swimmers (their ID, name, age, and eye color) in JSON format.

Generating our own JSON...

Simple DataFrame queries


Now that you have created the swimmersJSON DataFrame, we will be able to run the DataFrame API, as well as SQL queries against it. Let's start with a simple query showing all the rows within the DataFrame.

DataFrame API query

To do this using the DataFrame API, you can use the show(<n>) method, which prints the first n rows to the console:

Tip

Running the.show() method will default to present the first 10 rows.

# DataFrame API
swimmersJSON.show()

This gives the following output:

SQL query

If you prefer writing SQL statements, you can write the following query:

spark.sql("select * from swimmersJSON").collect()

This will give the following output:

We are using the .collect() method, which returns all the records as a list of Row objects. Note that you can use either the collect() or show() method for both DataFrames and SQL queries. Just make sure that if you use .collect(), this is for a small DataFrame, since it will return all of the rows in the DataFrame and move them...

Interoperating with RDDs


There are two different methods for converting existing RDDs to DataFrames (or Datasets[T]): inferring the schema using reflection, or programmatically specifying the schema. The former allows you to write more concise code (when your Spark application already knows the schema), while the latter allows you to construct DataFrames when the columns and their data types are only revealed at run time. Note, reflection is in reference to schema reflection as opposed to Python reflection.

Inferring the schema using reflection

In the process of building the DataFrame and running the queries, we skipped over the fact that the schema for this DataFrame was automatically defined. Initially, row objects are constructed by passing a list of key/value pairs as **kwargs to the row class. Then, Spark SQL converts this RDD of row objects into a DataFrame, where the keys are the columns and the data types are inferred by sampling the data.

Tip

The **kwargs construct allows you to pass...

Querying with the DataFrame API


As noted in the previous section, you can start off by using collect(), show(), or take() to view the data within your DataFrame (with the last two including the option to limit the number of returned rows).

Number of rows

To get the number of rows within your DataFrame, you can use the count() method:

swimmers.count()

This gives the following output:

Out[13]: 3

Running filter statements

To run a filter statement, you can use the filter clause; in the following code snippet, we are using the select clause to specify the columns to be returned as well:

# Get the id, age where age = 22
swimmers.select("id", "age").filter("age = 22").show()

# Another way to write the above query is below
swimmers.select(swimmers.id, swimmers.age).filter(swimmers.age == 22).show()

The output of this query is to choose only the id and age columns, where age = 22:

If we only want to get back the name of the swimmers who have an eye color that begins with the letter b, we can use a SQL-like...

Querying with SQL


Let's run the same queries, except this time, we will do so using SQL queries against the same DataFrame. Recall that this DataFrame is accessible because we executed the .createOrReplaceTempView method for swimmers.

Number of rows

The following is the code snippet to get the number of rows within your DataFrame using SQL:

spark.sql("select count(1) from swimmers").show()

The output is as follows:

Running filter statements using the where Clauses

To run a filter statement using SQL, you can use the where clause, as noted in the following code snippet:

# Get the id, age where age = 22 in SQL
spark.sql("select id, age from swimmers where age = 22").show()

The output of this query is to choose only the id and age columns where age = 22:

As with the DataFrame API querying, if we want to get back the name of the swimmers who have an eye color that begins with the letter b only, we can use the like syntax as well:

spark.sql(
"select name, eyeColor from swimmers where eyeColor like 'b%...

DataFrame scenario – on-time flight performance


To showcase the types of queries you can do with DataFrames, let's look at the use case of on-time flight performance. We will analyze the Airline On-Time Performance and Causes of Flight Delays: On-Time Data (http://bit.ly/2ccJPPM), and join this with the airports dataset, obtained from the Open Flights Airport, airline, and route data (http://bit.ly/2ccK5hw), to better understand the variables associated with flight delays.

Tip

For this section, we will be using Databricks Community Edition (a free offering of the Databricks product), which you can get at https://databricks.com/try-databricks. We will be using visualizations and pre-loaded datasets within Databricks to make it easier for you to focus on writing the code and analyzing the results.

If you would prefer to run this on your own environment, you can find the datasets available in our GitHub repository for this book at https://github.com/drabastomek/learningPySpark.

Preparing the source...

Spark Dataset API


After this discussion about Spark DataFrames, let's have a quick recap of the Spark Dataset API. Introduced in Apache Spark 1.6, the goal of Spark Datasets was to provide an API that allows users to easily express transformations on domain objects, while also providing the performance and benefits of the robust Spark SQL execution engine. As part of the Spark 2.0 release (and as noted in the diagram below), the DataFrame APIs is merged into the Dataset API thus unifying data processing capabilities across all libraries. Because of this unification, developers now have fewer concepts to learn or remember, and work with a single high-level and type-safe API – called Dataset:

Conceptually, the Spark DataFrame is an alias for a collection of generic objects Dataset[Row], where a Row is a generic untyped JVM object. Dataset, by contrast, is a collection of strongly-typed JVM objects, dictated by a case class you define, in Scala or Java. This last point is particularly important...

Summary


With Spark DataFrames, Python developers can make use of a simpler abstraction layer that is also potentially significantly faster. One of the main reasons Python is initially slower within Spark is due to the communication layer between Python sub-processes and the JVM. For Python DataFrame users, we have a Python wrapper around Scala DataFrames that avoids the Python sub-process/JVM communication overhead. Spark DataFrames has many performance enhancements through the Catalyst Optimizer and Project Tungsten which we have reviewed in this chapter. In this chapter, we also reviewed how to work with Spark DataFrames and worked on an on-time flight performance scenario using DataFrames.

In this chapter, we created and worked with DataFrames by generating the data or making use of existing datasets.

In the next chapter, we will discuss how to transform and understand your own data.

lock icon
The rest of the chapter is locked
You have been reading a chapter from
Learning PySpark
Published in: Feb 2017Publisher: PacktISBN-13: 9781786463708
Register for a free Packt account to unlock a world of extra content!
A free Packt account unlocks extra newsletters, articles, discounted offers, and much more. Start advancing your knowledge today.
undefined
Unlock this book and the full library FREE for 7 days
Get unlimited access to 7000+ expert-authored eBooks and videos courses covering every tech area you can think of
Renews at $15.99/month. Cancel anytime

Authors (2)

author image
Tomasz Drabas

Tomasz Drabas is a Data Scientist working for Microsoft and currently residing in the Seattle area. He has over 12 years' international experience in data analytics and data science in numerous fields: advanced technology, airlines, telecommunications, finance, and consulting. Tomasz started his career in 2003 with LOT Polish Airlines in Warsaw, Poland while finishing his Master's degree in strategy management. In 2007, he moved to Sydney to pursue a doctoral degree in operations research at the University of New South Wales, School of Aviation; his research crossed boundaries between discrete choice modeling and airline operations research. During his time in Sydney, he worked as a Data Analyst for Beyond Analysis Australia and as a Senior Data Analyst/Data Scientist for Vodafone Hutchison Australia among others. He has also published scientific papers, attended international conferences, and served as a reviewer for scientific journals. In 2015 he relocated to Seattle to begin his work for Microsoft. While there, he has worked on numerous projects involving solving problems in high-dimensional feature space.
Read more about Tomasz Drabas

author image
Denny Lee

Denny Lee is a Principal Program Manager at Microsoft for the Azure DocumentDB teamMicrosoft's blazing fast, planet-scale managed document store service. He is a hands-on distributed systems and data science engineer with more than 18 years of experience developing Internet-scale infrastructure, data platforms, and predictive analytics systems for both on-premise and cloud environments. He has extensive experience of building greenfield teams as well as turnaround/ change catalyst. Prior to joining the Azure DocumentDB team, Denny worked as a Technology Evangelist at Databricks; he has been working with Apache Spark since 0.5. He was also the Senior Director of Data Sciences Engineering at Concur, and was on the incubation team that built Microsoft's Hadoop on Windows and Azure service (currently known as HDInsight). Denny also has a Masters in Biomedical Informatics from Oregon Health and Sciences University and has architected and implemented powerful data solutions for enterprise healthcare customers for the last 15 years.
Read more about Denny Lee