Reader small image

You're reading from  Learning ELK Stack

Product typeBook
Published inNov 2015
Publisher
ISBN-139781785887154
Edition1st Edition
Right arrow
Author (1)
Saurabh Chhajed
Saurabh Chhajed
author image
Saurabh Chhajed

Saurabh Chhajed is a technologist with vast professional experience in building Enterprise applications that span across product and service industries. He has experience building some of the largest recommender engines using big data analytics and machine learning, and also enjoys acting as an evangelist for big data and NoSQL technologies. With his rich technical experience, Saurabh has helped some of the largest financial and industrial companies in USA build their large product suites and distributed applications from scratch. He shares his personal experiences with technology at http://saurzcode.in. Saurabh has also reviewed books by Packt Publishing, Apache Camel Essentials and Java EE 7 Development with NetBeans 8, in the past.
Read more about Saurabh Chhajed

Right arrow

Chapter 8. Putting It All Together

In the previous chapters, we looked at the basics of Elasticsearch, Kibana, and Logstash. We saw the configurations and properties of each of them, and tried to understand what role each of the components plays in building a data pipeline for your data.

Now we will apply everything that we have learnt so far. We'll create an end-to-end running solution to analyze logs using ELK Stack.

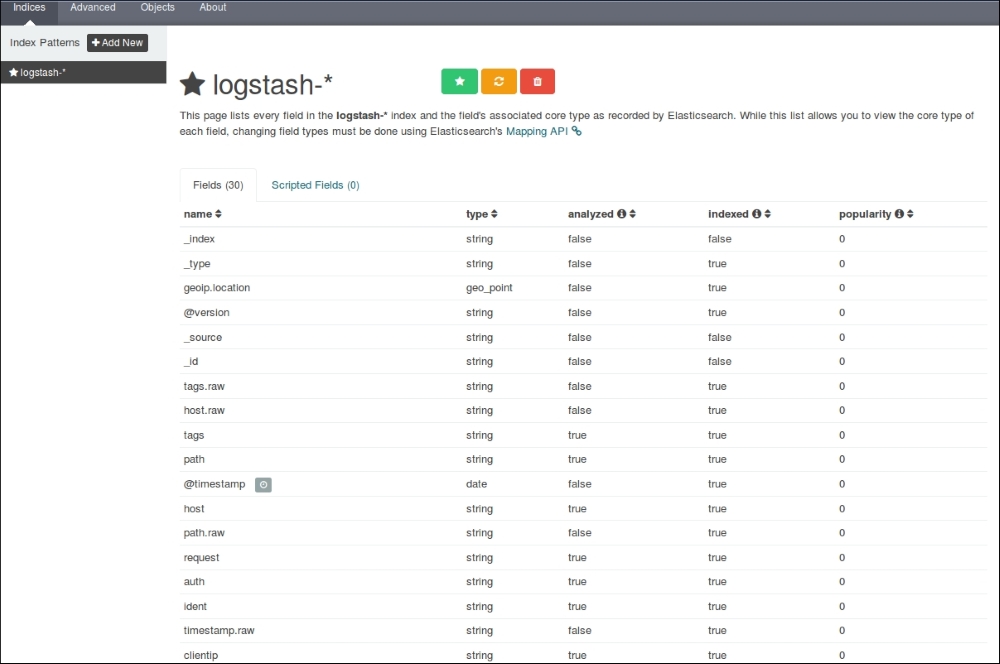
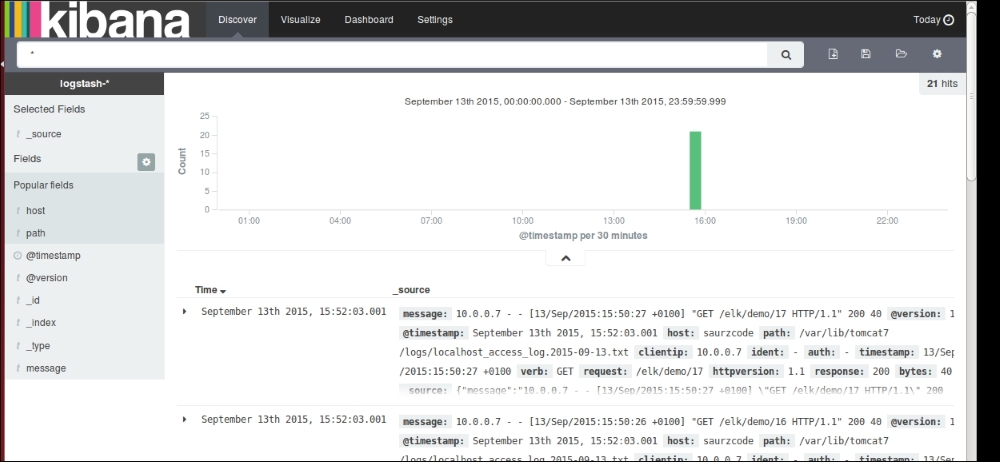
For demo purposes, we will use a sample web application that runs on the Tomcat server. We'll set up ELK Stack, where we'll use Logstash to collect, parse and index access logs to Elasticsearch. Finally, we'll see various searches and visualizations on it in the Kibana interface.

Input dataset


The input dataset is a continuous stream of Tomcat access logs in the following format:

10.0.0.2 - - [08/Sep/2015:17:39:46 +0100] "GET /elk/demo/10 HTTP/1.1" 200 40
10.0.0.2 - - [08/Sep/2015:17:39:47 +0100] "GET /elk/demo/11 HTTP/1.1" 200 39
10.0.0.3 - - [08/Sep/2015:17:39:48 +0100] "GET /elk/demo/12 HTTP/1.1" 200 39
10.0.0.2 - - [08/Sep/2015:17:39:49 +0100] "GET /elk/demo/13 HTTP/1.1" 200 39
10.0.0.2 - - [08/Sep/2015:17:39:50 +0100] "GET /elk/demo/14 HTTP/1.1" 200 39
10.0.0.4 - - [08/Sep/2015:17:39:51 +0100] "GET /elk/demo/15 HTTP/1.1" 200 40
10.0.0.2 - - [08/Sep/2015:17:39:52 +0100] "GET /elk/demo/16 HTTP/1.1" 200 39
10.0.0.2 - - [08/Sep/2015:17:39:53 +0100] "GET /elk/demo/17 HTTP/1.1" 200 39
10.0.0.5 - - [08/Sep/2015:17:39:54 +0100] "GET /elk/demo/18 HTTP/1.1" 200 39
10.0.0.2 - - [08/Sep/2015:17:39:55 +0100] "GET /elk/demo/19 HTTP/1.1" 200 39
10.0.0.2 - - [08/Sep/2015:17:39:56 +0100] "GET /elk/demo/20 HTTP/1.1" 200 40
10.0.0.6 - - [08/Sep/2015:17:39:57 +0100] "GET /elk/demo...

Configuring Logstash input


In this section, we'll configure Logstash to read data from access logs located on Tomcat, and index it in Elasticsearch, making filters and tokenization of terms in logs as per the grok pattern.

Grok pattern for access logs

As we already saw, some of the commonly used grok patterns are already included with the Logstash installation. Check out the list of Logstash grok patterns on GitHub at https://github.com/logstash-plugins/logstash-patterns-core/tree/master/patterns.

There is already a grok pattern for the Common Apache log format in the Logstash installation as follows:

COMMONAPACHELOG %{IPORHOST:clientip} %{USER:ident} %{USER:auth} \[%{HTTPDATE:timestamp}\] "(?:%{WORD:verb} %{NOTSPACE:request}(?: HTTP/%{NUMBER:httpversion})?|%{DATA:rawrequest})" %{NUMBER:response} (?:%{NUMBER:bytes}|-)

We can directly use COMMONAPACHELOG as a matching pattern for our incoming messages to Logstash as follows:

input{
file{
path =>"/var/lib/tomcat7/logs/localhost_access_logs.txt...

Visualizing with Kibana


Now that you have verified that your data is indexed successfully in Elasticsearch, we can go ahead and look at the Kibana interface to get some useful analytics from the data.

Running Kibana

As described in Chapter 1, Introduction to ELK Stack, we will start the Kibana service from the Kibana installation directory:

$ bin/kibana

Now, let's see Kibana up and running with a screen similar to the following screenshot on the browser with this URL:

http://localhost:5601

We can verify our index and fields in the Settings page under the indices tab as follows:

Kibana Settings page

It shows all our fields that were indexed, their data types, index status, and popularity value.

As we have already set up Kibana to take the logstash-* indexes by default, it starts to display the indexed data as a histogram of counts, and the associated data as fields in the JSON format as follows:

The Kibana Discover page showing indexed values

Searching on the Discover page

After our data is indexed...

Summary


In this chapter, we saw how we could build an end-to-end data pipeline built over our logs using ELK Stack, which helps us get useful analysis from our data. This chapter helped us understand how the features of Elasticsearch, Logstash, and Kibana come together to help build our own analytics pipeline.

In the next chapter, we'll take a look at some of the practical implementations of ELK Stack and how it is helping the industry.

lock icon
The rest of the chapter is locked
You have been reading a chapter from
Learning ELK Stack
Published in: Nov 2015Publisher: ISBN-13: 9781785887154
Register for a free Packt account to unlock a world of extra content!
A free Packt account unlocks extra newsletters, articles, discounted offers, and much more. Start advancing your knowledge today.
undefined
Unlock this book and the full library FREE for 7 days
Get unlimited access to 7000+ expert-authored eBooks and videos courses covering every tech area you can think of
Renews at $15.99/month. Cancel anytime

Author (1)

author image
Saurabh Chhajed

Saurabh Chhajed is a technologist with vast professional experience in building Enterprise applications that span across product and service industries. He has experience building some of the largest recommender engines using big data analytics and machine learning, and also enjoys acting as an evangelist for big data and NoSQL technologies. With his rich technical experience, Saurabh has helped some of the largest financial and industrial companies in USA build their large product suites and distributed applications from scratch. He shares his personal experiences with technology at http://saurzcode.in. Saurabh has also reviewed books by Packt Publishing, Apache Camel Essentials and Java EE 7 Development with NetBeans 8, in the past.
Read more about Saurabh Chhajed