Reader small image

You're reading from  Learning ELK Stack

Product typeBook
Published inNov 2015
Publisher
ISBN-139781785887154
Edition1st Edition
Right arrow
Author (1)
Saurabh Chhajed
Saurabh Chhajed
author image
Saurabh Chhajed

Saurabh Chhajed is a technologist with vast professional experience in building Enterprise applications that span across product and service industries. He has experience building some of the largest recommender engines using big data analytics and machine learning, and also enjoys acting as an evangelist for big data and NoSQL technologies. With his rich technical experience, Saurabh has helped some of the largest financial and industrial companies in USA build their large product suites and distributed applications from scratch. He shares his personal experiences with technology at http://saurzcode.in. Saurabh has also reviewed books by Packt Publishing, Apache Camel Essentials and Java EE 7 Development with NetBeans 8, in the past.
Read more about Saurabh Chhajed

Right arrow

Chapter 2. Building Your First Data Pipeline with ELK

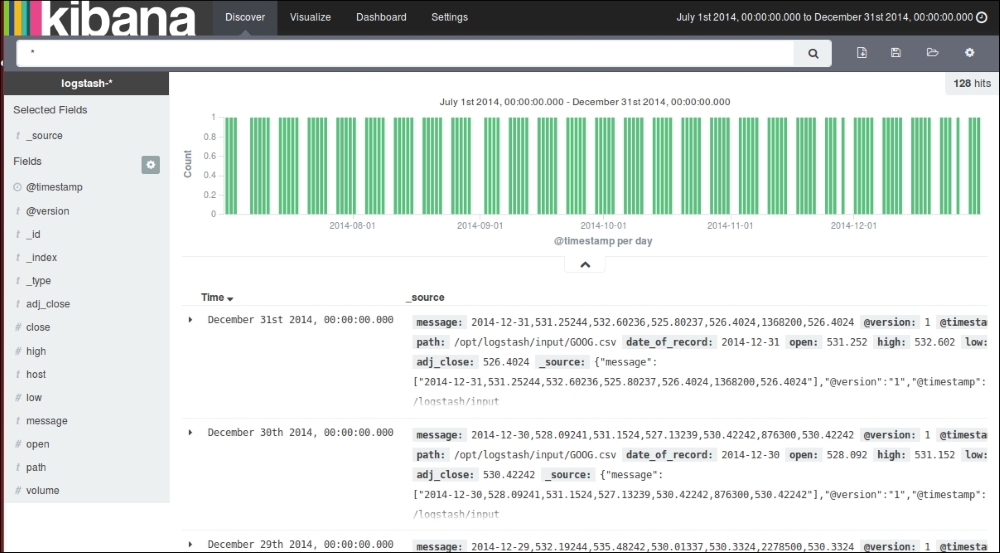
In the previous chapter, we got familiar with each component of ELK Stack—Elasticsearch, Logstash, and Kibana. We got the components installed and configured. In this chapter, we will build our first basic data pipeline using ELK Stack. This will help us understand how easy it is to get together the components of ELK Stack to build an end-to-end analytics pipeline.

While running the example in this chapter, we assume that you already installed Elasticsearch, Logstash, and Kibana as described in Chapter 1, Introduction to ELK Stack.

Input dataset


For our example, the dataset that we are going to use here is the daily Google (GOOG) Quotes price dataset over a 6 month period from July 1, 2014 to December 31, 2014. This is a good dataset to understand how we can quickly analyze simple datasets, such as these, with ELK.

Note

This dataset can be easily downloaded from the following source:

http://finance.yahoo.com/q/hp?s=GOOG

Data format for input dataset

The most significant fields of this dataset are Date, Open Price, Close Price, High Price, Volume, and Adjusted Price.

The following table shows some of the sample data from the dataset. The actual dataset is in the CSV format.

Configuring Logstash input


As we already know, Logstash has a rich set of plugins for different types of inputs, outputs and filters, which can read, parse, and filter data as per our needs. We will utilize the file input plugin to read the source file.

A file input plugin streams events from the input file, and each event is assumed as a single line. It automatically detects file rotation and handles it. It maintains the location where it left reading, and will automatically detect the new data if configured correctly. It reads files in a similar manner:

tail -0f 

In general, a file input plugin configuration will look as follows:

input {
 
file {
    path => #String (path of the files) (required) 
    start_position => #String (optional, default "end")
    tags => #array (optional)
    type => #string (optional)
}

}
  • path: The path field is the only required field in file input plugin, which represents the path of the file from where input events have to be processed.

  • start_position...

Filtering and processing input


Once we configure the input file, we need to filter the input based on our needs so that we can identify which fields we need, and process them as per the required analysis.

A filter plugin will perform the intermediary processing on the input event. We can apply the filter conditionally based on certain fields.

Since our input file is a CSV file, we will use the csv filter for the same. The csv filter takes an event field that contains CSV formatted data, parses it, and stores it as individual fields. It can also parse data with any separator other than commas. A typical csv filter is as follows:

filter {  
    csv {
        columns => #Array of column names.
        separator => #String ; default -","
    }
}

The attribute columns take the name of fields in our CSV file, which is optional. By default, the columns will be named as column 1, column 2, and so on.

The attribute separator defines what character is used to separate the different columns in the...

Putting data to Elasticsearch


Now that we have set up the data to be consumed by a CSV file into Logstash, followed by parsing and processing based on the data type needed, we now need to put the data in Elasticsearch so that we can index the different fields and consume them later via the Kibana interface.

We will use the output plugin of Logstash for an elasticsearch output.

A typical elasticsearch plugin configuration looks like this:

output {

  elasticsearch {

    action =>  # string (optional), default: "index"

    cluster =>  # string (optional)

    host =>  # string (optional)
   
    document_id =>  # string (optional), default: nil


    index =>  # string (optional), default: "logstash-%{+YYYY.MM.dd}"
    index_type =>  # string (optional)
    port =>  # string (optional)
    protocol =>  # string, one of ["node", "transport", "http"] (optional)
  }
}
  • action: This specifies what action to perform on incoming documents. The default is "index" and possible...

Visualizing with Kibana


Now when you verify that your data is indexed successfully in Elasticsearch, we can go ahead and look at the Kibana interface to get some useful analytics from the data.

Running Kibana

As described in the previous chapter, we will start the Kibana service from the Kibana installation directory.

$ bin/kibana

Now, let's see Kibana up and running similar to the following screenshot on the browser, by going to the following URL:

http://localhost:5601

Kibana Discover page

As we already set up Kibana to take logstash-* indexes by default, it displays the indexed data as a histogram of counts, and the associated data as fields in the JSON format.

First of all, we need to set the date filter to filter based on our date range so that we can build our analysis on the same. Since we took data from July 1, 2014 to December 31, 2014, we will configure our date filter for the same.

Clicking on the Time Filter icon at the extreme top-right corner, we can set an Absolute Time Filter based...

Summary


In this chapter, we saw how you can utilize different input, filter, and output plugins in Logstash to gather, parse, and index data to Elasticsearch, and later utilize the Kibana interface to query and visualize over Elasticsearch indexes. We also built some visualizations, and a dashboard using those visualizations. We successfully built our first data pipeline using ELK Stack. In the coming chapters, we will look at individual components in more detail.

lock icon
The rest of the chapter is locked
You have been reading a chapter from
Learning ELK Stack
Published in: Nov 2015Publisher: ISBN-13: 9781785887154
Register for a free Packt account to unlock a world of extra content!
A free Packt account unlocks extra newsletters, articles, discounted offers, and much more. Start advancing your knowledge today.
undefined
Unlock this book and the full library FREE for 7 days
Get unlimited access to 7000+ expert-authored eBooks and videos courses covering every tech area you can think of
Renews at $15.99/month. Cancel anytime

Author (1)

author image
Saurabh Chhajed

Saurabh Chhajed is a technologist with vast professional experience in building Enterprise applications that span across product and service industries. He has experience building some of the largest recommender engines using big data analytics and machine learning, and also enjoys acting as an evangelist for big data and NoSQL technologies. With his rich technical experience, Saurabh has helped some of the largest financial and industrial companies in USA build their large product suites and distributed applications from scratch. He shares his personal experiences with technology at http://saurzcode.in. Saurabh has also reviewed books by Packt Publishing, Apache Camel Essentials and Java EE 7 Development with NetBeans 8, in the past.
Read more about Saurabh Chhajed

Date

Open

High

Low

Close

Volume

Adj Close

Dec 31, 2014

531.25

532.60

525.80

526.40

1,368,200

526.40

Dec 30, 2014

528.09

531.15

527.13

530.42

876,300

530.42

Dec 29, 2014

532.19

535.48

530.01

530.33

2,278,500

530.33

Dec 26, 2014

528.77

534.25

527.31

534.03

1,036,000

534.03

Dec 24, 2014

530.51

531.76

527.02

528.77

...