Reader small image

You're reading from  Big Data Analysis with Python

Product typeBook
Published inApr 2019
Reading LevelIntermediate
PublisherPackt
ISBN-139781789955286
Edition1st Edition
Languages
Right arrow
Authors (3):
Ivan Marin
Ivan Marin
author image
Ivan Marin

Ivan Marin is a systems architect and data scientist working at Daitan Group, a Campinas-based software company. He designs big data systems for large volumes of data and implements machine learning pipelines end to end using Python and Spark. He is also an active organizer of data science, machine learning, and Python in So Paulo, and has given Python for data science courses at university level.
Read more about Ivan Marin

Ankit Shukla
Ankit Shukla
author image
Ankit Shukla

Ankit Shukla is a data scientist working with World Wide Technology, a leading US-based technology solution provider, where he develops and deploys machine learning and artificial intelligence solutions to solve business problems and create actual dollar value for clients. He is also part of the company's R&D initiative, which is responsible for producing intellectual property, building capabilities in new areas, and publishing cutting-edge research in corporate white papers. Besides tinkering with AI/ML models, he likes to read and is a big-time foodie.
Read more about Ankit Shukla

Sarang VK
Sarang VK
author image
Sarang VK

Sarang VK is a lead data scientist at StraitsBridge Advisors, where his responsibilities include requirement gathering, solutioning, development, and productization of scalable machine learning, artificial intelligence, and analytical solutions using open source technologies. Alongside this, he supports pre-sales and competency.
Read more about Sarang VK

View More author details
Right arrow

Visualization with Pandas


Pandas can be thought as a data Swiss Army knife, and one thing that a data scientist always needs when analyzing data is to visualize that data. We will go into detail on the kinds of plot that we can apply in an analysis. For now, the idea is to show how to do quick and dirty plots directly from pandas.

The plot function can be called directly from the DataFrame selection, allowing fast visualizations. A scatter plot can be created by using Matplotlib and passing data from the DataFrame to the plotting function. Now that we know the tools, let's focus on the pandas interface for data manipulation. This interface is so powerful that it is replicated by other projects that we will see in this course, such as Spark. We will explain the plot components and methods in more detail in the next chapter.

You will see how to create graphs that are useful for statistical analysis in the next chapter. Focus here on the mechanics of creating plots from pandas for quick visualizations.

Activity 3: Plotting Data with Pandas

To finish up our activity, let's redo all the previous steps and plot graphs with the results, as we would do in a preliminary analysis:

  1. Use the RadNet DataFrame that we have been working with.

  2. Fix all the data type problems, as we saw before.

  3. Create a plot with a filter per Location, selecting the city of San Bernardino, and one radionuclide, with the x-axis as date and the y-axis as radionuclide I-131:

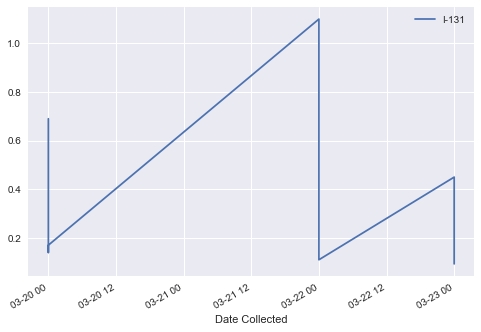
    Figure 1.17: Plot of Location with I-131

  4. Create a scatter plot with the concentration of two related radionuclides, I-131 and I-132:

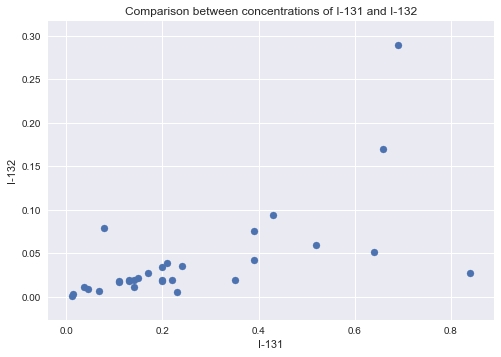
    Figure 1.18: Plot of I-131 and I-132

    Note

    The solution for this activity can be found on page 203.

We are getting a bit ahead of ourselves here with the plotting, so we don't need to worry about the details of the plot or how we attribute titles, labels, and so on. The important takeaway here is understanding that we can plot directly from the DataFrame for quick analysis and visualization.

Previous PageNext Page
You have been reading a chapter from
Big Data Analysis with Python
Published in: Apr 2019Publisher: PacktISBN-13: 9781789955286
Register for a free Packt account to unlock a world of extra content!
A free Packt account unlocks extra newsletters, articles, discounted offers, and much more. Start advancing your knowledge today.
undefined
Unlock this book and the full library FREE for 7 days
Get unlimited access to 7000+ expert-authored eBooks and videos courses covering every tech area you can think of
Renews at $15.99/month. Cancel anytime

Authors (3)

author image
Ivan Marin

Ivan Marin is a systems architect and data scientist working at Daitan Group, a Campinas-based software company. He designs big data systems for large volumes of data and implements machine learning pipelines end to end using Python and Spark. He is also an active organizer of data science, machine learning, and Python in So Paulo, and has given Python for data science courses at university level.
Read more about Ivan Marin

author image
Ankit Shukla

Ankit Shukla is a data scientist working with World Wide Technology, a leading US-based technology solution provider, where he develops and deploys machine learning and artificial intelligence solutions to solve business problems and create actual dollar value for clients. He is also part of the company's R&D initiative, which is responsible for producing intellectual property, building capabilities in new areas, and publishing cutting-edge research in corporate white papers. Besides tinkering with AI/ML models, he likes to read and is a big-time foodie.
Read more about Ankit Shukla

author image
Sarang VK

Sarang VK is a lead data scientist at StraitsBridge Advisors, where his responsibilities include requirement gathering, solutioning, development, and productization of scalable machine learning, artificial intelligence, and analytical solutions using open source technologies. Alongside this, he supports pre-sales and competency.
Read more about Sarang VK