


Data splitting
Training and evaluating ML models are key tasks of the modeling pipeline. ML algorithms need data to find relationships among features in order to make inferences, but those inferences need to be validated before they are moved to production environments.
The dataset used to train ML models is commonly called the training set. This training data must be able to represent the real environment where the model will be used; it will be useless if that requirement is not met.
Coming back to our fraud example presented in Figure 1.2, based on the training data, we found that e-commerce transactions with a value greater than $5,000 and processed at night are potentially fraudulent cases. With that in mind, after applying the model in a production environment, the model is supposed to flag similar cases, as learned during the training process.
Therefore, if those cases only exist in the training set, the model will flag false positive cases in production environments. The opposite scenario is also valid: if there is a particular fraud case in production data, not reflected in the training data, the model will flag a lot of false negative cases. False positives and false negatives ratios are just two of many quality metrics that we can use for model validation. These metrics will be covered in much more detail later on.
By this point, you should have a clear understanding of the importance of having a good training set. Now, supposing we do have a valid training set, how could we have some level of confidence that this model will perform well in production environments? The answer is: using testing and validation sets:
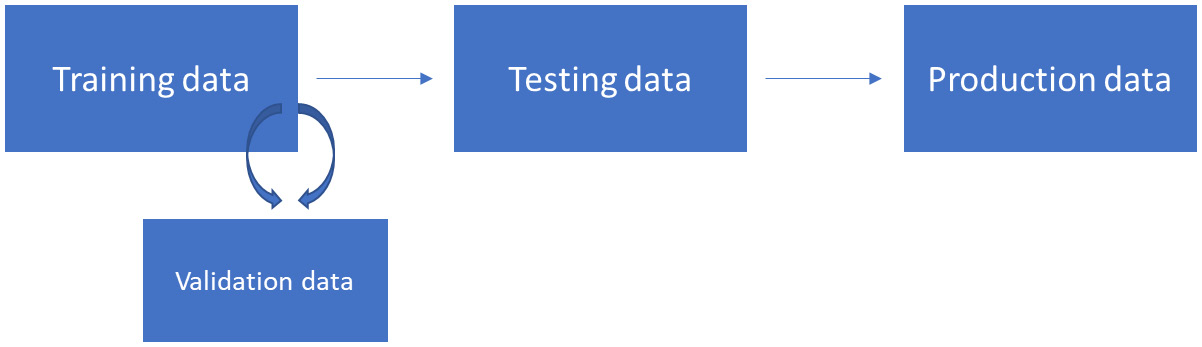
Figure 1.5 – Data splitting
Figure 1.5 shows the different types of data splitting that we can have during training and inference pipelines. The training data is the one used to create the model and the testing data is the one used to extract final model quality metrics. The testing data cannot be used during the training process for any reason other than to extract model metrics.
The reason to avoid using the testing data during training is simple: we cannot let the model learn on top of the data that will be used to validate it. This technique of holding one piece of the data for testing is often called hold-out validation.
The box on the right side of Figure 1.5 represents the production data. Production data usually comes in continuously and we have to execute the inference pipeline in order to extract model results from it. No training, nor any other type of recalculation, is performed on top of production data; we just have to pass it through the inference pipeline as it is.
From a technical perspective, most of the ML libraries implement training steps with the .fit method, while inference steps are implemented by the .transform or .predict method. Again, this is just a common pattern used by most ML libraries, but be aware that you might find different name conventions across ML libraries.
Still looking at Figure 1.5, there is another box, close to the training data, named validation data. This is a subset of the training set often used to support the creation of the best model, before moving to the testing phase. We will talk about that box in much more detail, but first, let's explain why we need them.
Overfitting and underfitting
ML models might suffer from two types of fitting issues: overfitting and underfitting. Overfitting means that your model performs very well in the training data, but cannot be generalized to other datasets, such as testing and, even worse, production data. In other words, if you have an overfitted model, it only works on your training data.
When we are building ML models, we want to create solutions that are able to generalize what they have learned and infer decisions on other datasets that follow the same data distribution. A model that only works on the data that it was trained on is useless. Overfitting usually happens due to the large number of features or the lack of configuration of the hyperparameters of the algorithm.
On the other hand, underfitted models cannot fit the data during the training phase. As a result, they are so generic that they can't perform well with the training, testing, or production data. Underfitting usually happens due to the lack of good features/observations or due to the lack of time to train the model (some algorithms need more iterations to properly fit the model).
Both overfitting and underfitting need to be avoided. There are many modeling techniques to work around that. For instance, let's focus on the commonly used cross-validation technique and its relationship with the validation box showed in Figure 1.5.
Applying cross-validation and measuring overfitting
Cross-validation is a technique where we split the training set into training and validation sets. The model is then trained on the training set and tested on the validation set. The most common cross-validation strategy is known as k-fold cross validation, where k is the number of splits of the training set.
Using k-fold cross-validation and assuming the value of k equals 10, we are splitting the train set into 10 folds. The model will be trained and tested 10 times. On each iteration, it uses nine splits for training and leaves one split for testing. After 10 executions, the evaluation metrics extracted from each iteration are averaged and will represent the final model performance during the training phase, as shown in Figure 1.6:

Figure 1.6 – Cross-validation in action
Another common cross-validation technique is known as leave one out cross-validation (LOOCV). In this approach, the model is executed many times and, with each iteration, one observation is separated for testing and all the others are used for training.
There are many advantages of using cross-validation during training:
- We mitigate overfitting in the training data, since the model is always trained on a particular chunk of data and tested on another chunk that hasn't been used for training.
- We avoid overfitting in the test data, since there is no need to keep using the testing data to optimize the model.
- We expose the presence of overfitting or underfitting. If the model performance in the training/validation data is very different from the performance observed in the testing data, something is wrong.
Let's elaborate a little more on the third item on that list, since this is covered in the AWS Machine Learning Specialty exam. Let's assume we are creating a binary classification model, using cross-validation during training and using a testing set to extract final metrics (hold-out validation). If we get 80% accuracy in the cross-validation results and 50% accuracy in the testing set, it means that the model was overfitted to the train set, and cannot be generalized to the test set.
On the other hand, if we get 50% accuracy in the training set and 80% accuracy in the test set, there is a systemic issue in the data. It is very likely that the training and testing sets do not follow the same distribution.
Important note
Accuracy is a model evaluation metric commonly used on classification models. It measures how often the model made a correct decision during its inference process. We have selected this metric just for the sake of example, but be aware that there are many other evaluation metrics applicable for each type of model (which will be covered at the appropriate time).
Bootstrapping methods
Cross-validation is a good strategy to validate ML models, and you should try it in your daily activities as a data scientist. However, you should also know about other resampling techniques available out there. Bootstrapping is one of them.
While cross-validation works with no replacement, a bootstrapping approach works with replacement. With replacement means that, while you are drawing multiple random samples from a population dataset, the same observation might be duplicated across samples.
Usually, bootstrapping is not used to validate models as we do in the traditional cross-validation approach. The reason is simple: since it works with replacement, the same observation used for training could potentially be used for testing, too. This would result in inflated model performance metrics, since the estimator is likely to be correct when predicting an observation that was already seen in the training set.
Bootstrapping is often used by ML algorithms in an embedded way that requires resampling capabilities to process the data. In this context, bootstrapping is not being used to validate the model, but to create the model. Random forest, which will be covered in the algorithms chapter, is one of those algorithms that uses bootstrapping internally for model building.
Designing a good data splitting/sampling strategy is crucial to the success of the model or the algorithm. You should come up with different approaches to split your data, check how the model is performing on each split, and make sure those splits represent the real scenario where the model will be used.
The variance versus bias trade-off
Any ML model is supposed to contain errors. There are three types of errors that we can find on models: bias error, variance error, and unexplained error. The last one, as expected, cannot be explained. It is often related to the context of the problem and the relationships between the variables, and we can't control it.
The other two errors can be controlled during modeling. We usually say that there is a trade-off between bias and variance errors because one will influence the other. In this case, increasing bias will decrease variance and vice versa.
Bias error relates to assumptions taken by the model to learn the target function, the one that we want to solve. Some types of algorithms, such as linear algorithms, usually carry over that type of error because they make a lot of assumptions during model training. For example, linear models assume that the relationship present in the data is linear. Linear regression and logistic regression are types of algorithms that, in general, contain high bias. Decision trees, on the other hand, are types of algorithms that make fewer assumptions about the data and contain less bias.
Variance relates to the difference of estimations that the model performs on different training data. Models with high variance usually overfit to the training set. Decision trees are examples of algorithms with high variance (they usually rely a lot on specifics of the training set, failing to generalize), and linear/logistic regression are examples of algorithms with low variance. It does not mean that decision trees are bad estimators; it just means that we need to prune (optimize) them during training.
That said, the goal of any model is to minimize both bias and variance. However, as already mentioned, each one will impact the other in the opposite direction. For the sake of demonstration, let's use a decision tree to understand how this trade-off works.
Decision trees are nonlinear algorithms and often contain low bias and high variance. In order to decrease variance, we can prune the tree and set the max_depth hyperparameter (the maximum allowed depth of the tree) to 10. That will force a more generic model, reducing variance. However, that change will also force the model to make more assumptions (since it is now more generic) and increase bias.
Shuffling your training set
Now that you know what variance and data splitting are, let's dive a little deeper into the training dataset requirements. You are very likely to find questions around data shuffling in the exam. This process consists of randomizing your training dataset before you start using it to fit an algorithm.
Data shuffling will help the algorithm to reduce variance by creating a more generalizable model. For example, let's say your training represents a binary classification problem and it is sorted by the target variable (all cases belonging to class "0" appear first, then all the cases belonging to class "1").
When you fit an algorithm on this sorted data (especially some algorithms that rely on batch processing), it will take strong assumptions on the pattern of one of the classes, since it is very likely that it won't be able to create random batches of data with a good representation of both classes. Once the algorithm builds strong assumptions about the training data, it might be difficult for it to change them.
Important note
Some algorithms are able to execute the training process by fitting the data in chunks, also known as batches. This approach lets the model learn more frequently, since it will make partial assumptions after processing each batch of data (instead of making decisions only after processing the entire dataset).
On the other hand, there is no need to shuffle the test set, since it will be used only by the inference process to check model performance.