


To get started in terms of creating our visualizations, we will be using Tableau Desktop Professional Edition Version 10.1. This is the latest version of Tableau products and offers compatibility with both Windows OS as well as Mac OS. However, for the sake of a wider audience, we will be using the Windows-OS-compatible version in this book. That said, those using version 10.1 on a Mac OS should not see much of a difference since the User Interface and functionality is essentially the same.
Before we get started, we need to make sure that Tableau Desktop Professional Edition Version 10.1 is downloaded and installed on our machines.
Tip
Note that if we use Tableau Public, then some of the protocols for saving our work will change since Tableau Public doesn't allow us to save our work locally. Also, if we use Tableau Desktop Personal Edition, then apart from certain limitations, such as being able to connect to databases, the rest of the functionality will mostly remain the same.
If you are an existing licensed user of Tableau Desktop, then make sure that you are using the latest version. If the version is anything below 10.1, then it is recommended that you upgrade it to the latest version, as there are significant changes in terms of the User Interface as well as features. Nonetheless, even if we decide to continue with the earlier versions, the majority of the fundamental concepts and features outlined in this book would remain the same, although their implementation may differ.
If you do not have a license, the 14-day full-feature trial of Tableau Desktop Professional Version 10.1 can be installed and downloaded from Tableau's website (http://www.tableau.com/).
Tableau, being a plug and play software, simply needs to be downloaded and installed just like any .exe or .dmg installable.
Download and install Tableau Desktop Professional 10.1.
Upon installation, you can activate the trial version by registering your details; alternatively, if you have a license key, then you can activate the license by entering the same. We are now ready to get started.
When we click on the Tableau 10.1 icon on the desktop, we will see the starting or landing page of Tableau. Check out the following screenshot:

The Start Page of Tableau is divided into three parts, namely Connect, Open, and Discover; refer to the numbers 1, 2, and 3 respectively in the preceding screenshot.
The top-left corner, which says Connect (number 1), consists of three sections called To a File, To a Server, and Saved Data Sources. In each of these sections, we will see the list of data sources that Tableau can connect to.
The To a File section consists of flat file data sources such as Excel files, Access files, Text files, JSON files, and statistical files, including SAS, SPSS, and R. Clicking on the More… option under this section allows us to even connect to Tableau's data extract files, which we will understand in detail in the later chapters.
The To a Server section consists of data sources such as Microsoft SQL Server, MySQL, Oracle, and so on. To see a more detailed list of data sources that Tableau can connect to, we need to click on the More… option and expand the section by clicking on the arrow. Refer to the following image that illustrates this:
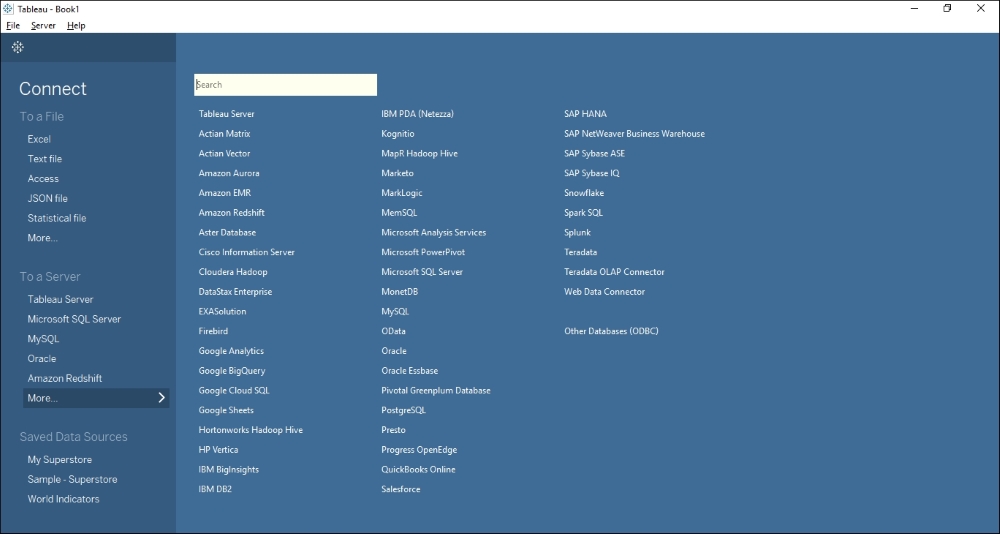
Just below the To a Server section, we will see the Saved Data Sources section. This section essentially points to those data sources that have been previously worked on and then saved for later purposes. Currently, we will not use this option and we will start by connecting to the raw data and not use any of the existing saved data sources.
Adjacent to the Connect header is an empty section that is covered under the header Open (number 2). This is the section where we will see the thumbnails of all our recently opened workbooks. This section is blank to begin with; however, as we create and save new workbooks, this section will display the thumbnails of the nine most recently opened workbooks.
This section also gives us access to some sample workbooks that are provided by Tableau for our reference. We can open these workbooks in Tableau Desktop to see how certain functionalities are used or how a particular visualization is created in Tableau.
Note
A workbook in Tableau is similar to that of Excel. Just as an Excel workbook consists of multiple sheets, the workbook in Tableau contains multiple worksheets, and/or dashboards, and/or stories. The worksheet in Tableau consists of one view/visualization/report, whereas a dashboard is a combination of multiple worksheets which when viewed will provide the viewer with a holistic view.
The next section is the Discover section (number 3). This section basically provides links to resources that are available on the Tableau website. Apart from the training videos, this section also shows the blogs, forums, latest news about Tableau, as well as the views that are selected as the Viz of the week on Tableau Public.


