

Exercises
- Use the
adult.csvdataset and run the code shown in the following screenshots. Then, answer the questions that follow: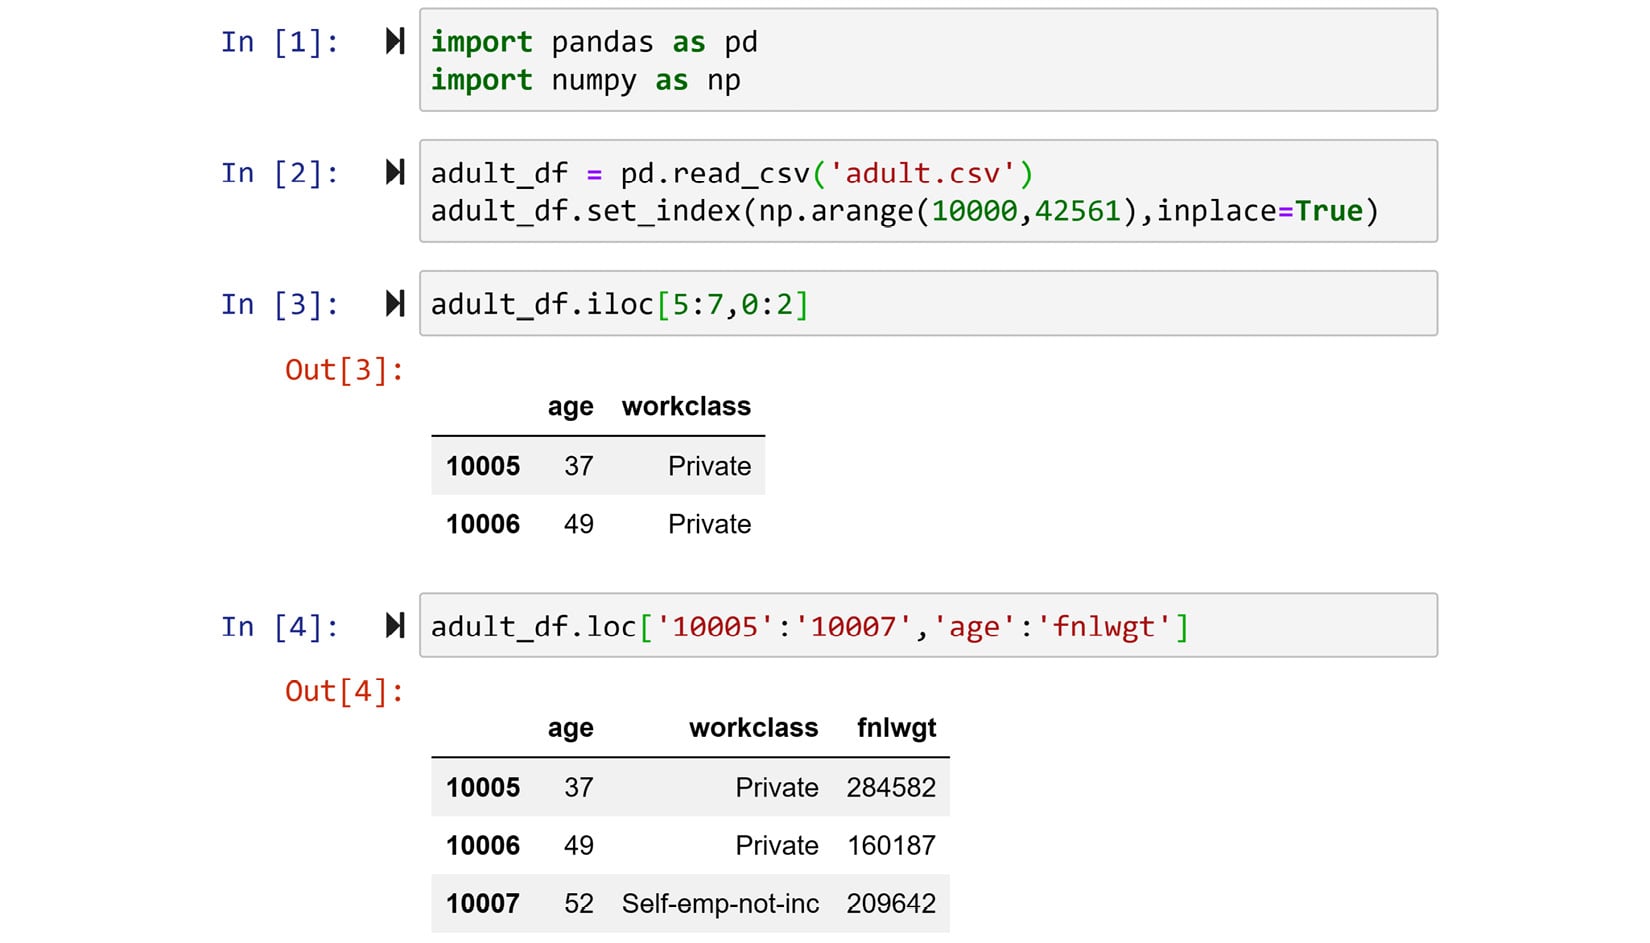
Figure 1.48 – Exercise 1
a) Use the output to answer what is the difference in behavior of
.locand.ilocwhen it comes to slicing?b) Without running, but just by looking at the data, what will be the output of
adult_df.loc['10000':'10003', 'relationship':'sex']?c) Without running, but just by looking at the data, what will be the output of
adult_df.iloc[0:3, 7:9]? - Use Pandas to read
adult.csvintoadult_dfand then use the.groupby()function to run the following code and create the multi-index seriesmlt_sr:import pandas as pd adult_df = pd.read_csv('adult.csv') mlt_seris =adult_df.groupby(['race','sex','income']).fnlwgt.mean() mlt_serisa) Now that you have created a multi-index series, run the following code, study the outputs, and answer the following questions:
Run the following code first and then answer this question: When we use
.iloc[]for a multi-index series or DataFrame, what should we expect?print(mlt_seris.iloc[0]) print(mlt_seris.iloc[1]) print(mlt_seris.iloc[2])
b) Run the following code first and then answer this question: When we use
.loc[]to access the data of one of the innermost index levels of the multi-index series, what should we expect?mlt_seris.loc['Other']
c) Run the following code first and then answer this question: When we use
.loc[]to access the data of one of the non-innermost index levels of a multi-index series, what should we expect?When you run either line of the following code, you will get an error, and that is the point of this question. Study the error and try to answer the question:
mlt_seris.loc['Other']
mlt_seris.loc['<=50K']
d) Run the following code first and then answer this question: How does the use of
.loc[]or.iloc[]differ when working with a multi-index series or a DataFrame?print(mlt_seris.loc['Other']['Female']['<=50K']) print(mlt_seris.iloc[12])
- For this exercise, you need to use a new dataset:
billboard.csv. Visit https://www.billboard.com/charts/hot-100 and see the latest song rankings of the day. This dataset presents information and rankings for 317 song tracks in 80 columns. The first four columns areartist,track,time, anddate_e. The first columns are intuitive descriptions of song tracks. Thedate_ecolumn shows the date that the songs entered the hot 100 list. The rest of the 76 columns are song rankings at the end of each week from "w1" to "w76". Download and read this dataset using Pandas and answer the following questions:a) Write one line of code that gives you a great idea of how many null values each column has. If any columns have no non-null values, drop them.
b) With a
forloop, draw and study the values in each of the remaining W columns.c) The dataset is in wide format. Use an appropriate function to switch to a long format and name the transformed DataFrame
mlt_df.d) Write code that shows
mlt_dfevery 1,200 rows.e) Run the following code first and answer this question: Could this also have been done by using Boolean masking?
mlt_df.query('artist == "Spears, Britney"')f) Use either the approach in e or the Boolean mask to extract all the unique songs that Britney Spears has in this dataset.
g) In
mlt_df, show all of the weeks when the song "Oops!.. I Did It Again" was in the top 100. - We will use
LaqnData.csvfor this exercise. Each row of this dataset shows an hourly measurement recording of one of the following five air pollutants: NO, NO2, NOX, PM10, and PM2.5. The data was collected in a location in London for the entirety of the year 2017. Read the data using Pandas and perform the following tasks:a) The dataset has six columns. Three of them, named '
Site', 'Units', and 'ProvisionalorRatified' are not adding any informational values as they are the same across the whole dataset. Use the following code to drop them:air_df.drop(columns=['Site','Units','Provisional or Ratified'], inplace=True)
b) The dataset is in a long format. Apply the appropriate function to switch it to the wide format. Name the transformed Dataframe
pvt_df.c) Draw and study the histogram and boxplots for columns of
pvt_df. - We will continue working with
LaqnData.csv:a) Run the following code, see its output, and then study the code to answer what each line of this code does:
air_df = pd.read_csv('LaqnData.csv')
air_df.drop(columns=['Site','Units','Provisional or Ratified'], inplace=True)
datetime_df = air_df.ReadingDateTime.str.split(' ',expand=True)
datetime_df.columns = ['Date','Time']
date_df = datetime_df.Date.str.split('/',expand=True)
date_df.columns = ['Day','Month','Year']
air_df = air_df.join(date_df).join(datetime_df.Time).drop(columns=['ReadingDateTime','Year'])
air_df
b) Run the following code, see its output, and then study the code to answer what this line of code does:
air_df = air_df.set_index(['Month','Day','Time','Species'])
air_df
c) Run the following code, see its output, and then study the code to answer what this line of code does:
air_df.unstack()
d) Compare the output of the preceding code with
pvt_dffrom Exercise 4. Are they the same?e) Explain what the differences and similarities are between the pair
.melt()/.pivot()and the pair.stack()/.unstack()?f) If you were to choose one counterpart for
.melt()between.stack()/.unstack(), which one would you choose?