Reader small image

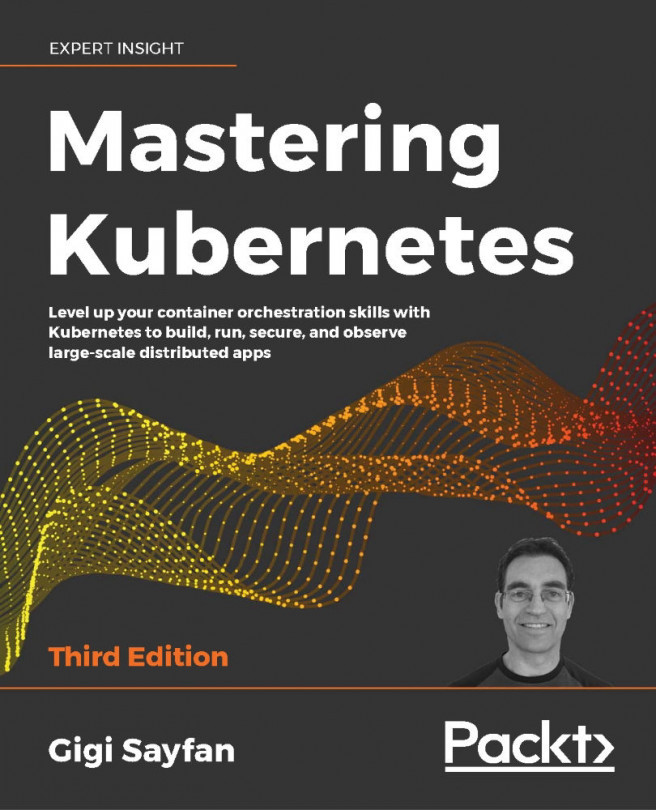
You're reading from  Mastering Kubernetes, - Third Edition

Product typeBook
Published inJun 2020
PublisherPackt
ISBN-139781839211256
Edition3rd Edition
Right arrow
Author (1)
Gigi Sayfan
Gigi Sayfan
author image
Gigi Sayfan

Gigi Sayfan has been developing software for 25+ years in domains as diverse as instant messaging, morphing, chip fabrication process control, embedded multimedia applications for game consoles, brain-inspired ML, custom browser development, web services for 3D distributed game platforms, IoT sensors, virtual reality, and genomics. He has written production code in languages such as Go, Python, C, C++, C#, Java, Delphi, JavaScript, and even Cobol and PowerBuilder for operating systems such as Windows (3.11 through 7), Linux, macOS, Lynx (embedded), and Sony PlayStation. His technical expertise includes databases, low-level networking, distributed systems, containers, unorthodox user interfaces, modern web applications, and general SDLC.
Read more about Gigi Sayfan

Right arrow

Monitoring Kubernetes Clusters

In the previous chapter, we looked at serverless computing and its manifestations on Kubernetes. A lot of innovation happens in this space and it's both super useful and fascinating to follow the evolution.

In this chapter, we're going to talk about how to make sure your systems are up and running, performing correctly, and how to respond to them when they aren't. In Chapter 3, High Availability and Reliability, we discussed related topics. The focus here is about knowing what's going on in your system and what practices and tools you can use.

The are many aspects to monitoring, such as logging, metrics, distributed tracing, error reporting, and alerting. Practices like auto-scaling and self-healing depend on monitoring to detect that there is a need to scale or to heal.

The topics we will cover in this chapter include:

  • Understanding observability
  • Logging with Kubernetes
  • Recording metrics with...

Understanding observability

Observability is a big word. What does it mean in practice? There are different definitions out there and big debates regarding how monitoring and observability are similar and different. I take the stance that observability is the property of the system that defines what we can tell about the state and behavior of the system, right now and historically. In particular, we are interested in the health of the system and its components. Monitoring is the collection of tolls, processes, and techniques we use to increase the observability of the system.

There are different facets of information that we need to collect, record, and aggregate in order to get a good sense of what our system is doing. Those facets include logs, metrics, distributed traces, and errors. The monitoring or observability data is multi-dimensional and crosses many levels. Just collecting it doesn't help much. We need to be able to query it, visualize it, and alert other systems...

Logging with Kubernetes

We need to carefully consider our logging strategy with Kubernetes. There are several types of logs that are relevant for monitoring purposes. Our workloads run in containers, of course, and we care about these logs, but we also care about the logs of Kubernetes components such as kubelets and the container runtime. In addition, chasing logs across multiple nodes and containers is a non-starter. The best practice is to use central logging (also known as log aggregation). There are several options here that we will explore soon.

Container logs

Kubernetes stores the standard output and standard error of every container. They are made available through the kubectl logs command.

Here is a pod manifest that prints the current date and time every 10 seconds:

apiVersion: v1
kind: Pod
metadata:
  name: now
spec:
  containers:
    - name: now
      image: g1g1/py-kube:0.2
      command: ["/bin/bash", "-c", "while true; do sleep...

Collecting metrics with Kubernetes

If you have some experience with Kubernetes, you may be familiar with cAdvisor and Heapster. cAdvisor was integrated into the kube-proxy until Kubernetes 1.12 and then it was removed. Heapster was removed in Kubernetes 1.13. If you wish, you can install them, but they are not recommended anymore as there are much better solutions now.

One caveat is that the Kubernetes dashboard v1 still depends on Heapster. The Kubernetes dashboard v2 is still in Beta at the time of writing. Hopefully, it will be generally available by the time you read this.

Kubernetes now has a Metrics API. It supports node and pod metrics out of the box. You can also define your own custom metrics.

A metric contains a timestamp, a usage field, and the time range the metric was collected (many metrics are accumulated over a time period). Here is the API definition for node metrics:

type NodeMetrics struct {
    metav1.TypeMeta
    metav1.ObjectMeta
    Timestamp...

Distributed tracing with Jaeger

In microservice-based systems, every request may travel between multiple microservices calling each other, wait in queues, and trigger serverless functions. To debug and troubleshoot such systems, you need to be able to keep track of requests and follow them along their path.

Distributed tracing provides several capabilities that allow you, the developers, and the operators to understand their distributed systems:

  • Distributed transaction monitoring
  • Performance and latency tracking
  • Root cause analysis
  • Service dependency analysis
  • Distributed context propagation

Distributed tracing often requires participation of the applications and services instrumenting endpoints. Since the microservices world is polyglot, multiple programming languages may be used. It makes sense to use a shared distributed tracing specification and framework that supports many programming languages. Enter OpenTracing...

...

Troubleshooting problems

Troubleshooting a complex distributed system is no picnic. Abstractions, separation of concerns, information hiding, and encapsulation are great during development, testing, and when making changes to the system. But when things go wrong, you need to cross all those boundaries and layers of abstraction from the user action in their app through the entire stack, all the way to the infrastructure, thus crossing all the business logic, asynchronous processes, legacy systems, and third-party integrations. This is a challenge, even with large monolithic systems, but even more so with microservice-based distributed systems. Monitoring will assist you, but let's talk first about preparation, processes, and best practices.

Taking advantage of staging environments

When building a large system, developers work on their local machines (ignoring cloud development environments here) and eventually, the code is deployed to the production environment. However...

Summary

In this chapter, we covered the topics of monitoring, observability, and, in general, day 2 operations. We started with a review of the various aspects of monitoring: logs, metrics, error reporting, and distributed tracing. Then, we discussed how to incorporate monitoring capabilities into your Kubernetes cluster. We looked at several CNCF projects like Fluentd for log aggregation, Prometheus for metrics collection and alert management, Grafana for visualization, and Jaeger for distributed tracing. Then, we explored troubleshooting large distributed systems. We realized how difficult it can be and why we need so many different tools to conquer the issues.

In the next chapter, we will take things to the next level and dive into service meshes. I'm super excited about service meshes because they take much of the complexity related to cloud-native, microservice-based applications and externalize them outside of the microservices. That has a lot of real-world value.

...
lock icon
The rest of the chapter is locked
You have been reading a chapter from
Mastering Kubernetes, - Third Edition
Published in: Jun 2020Publisher: PacktISBN-13: 9781839211256
Register for a free Packt account to unlock a world of extra content!
A free Packt account unlocks extra newsletters, articles, discounted offers, and much more. Start advancing your knowledge today.
undefined
Unlock this book and the full library FREE for 7 days
Get unlimited access to 7000+ expert-authored eBooks and videos courses covering every tech area you can think of
Renews at €14.99/month. Cancel anytime

Author (1)

author image
Gigi Sayfan

Gigi Sayfan has been developing software for 25+ years in domains as diverse as instant messaging, morphing, chip fabrication process control, embedded multimedia applications for game consoles, brain-inspired ML, custom browser development, web services for 3D distributed game platforms, IoT sensors, virtual reality, and genomics. He has written production code in languages such as Go, Python, C, C++, C#, Java, Delphi, JavaScript, and even Cobol and PowerBuilder for operating systems such as Windows (3.11 through 7), Linux, macOS, Lynx (embedded), and Sony PlayStation. His technical expertise includes databases, low-level networking, distributed systems, containers, unorthodox user interfaces, modern web applications, and general SDLC.
Read more about Gigi Sayfan