Reader small image

You're reading from  Data Modeling with Microsoft Excel

Product typeBook
Published inNov 2023
PublisherPackt
ISBN-139781803240282
Edition1st Edition
Right arrow
Author (1)
Bernard Obeng Boateng
author image
Bernard Obeng Boateng

Bernard Obeng Boateng is a Microsoft Excel MVP, Microsoft Certified Trainer, with over 10 years work experience in Banking, Insurance and Business Development. He is founder of Finex Skills Hub an approved Training Provider of the Financial Modeling Institute, Canada. Finex Skills Hub runs the Finex Project in Ghana, a pro bono student training outreach program for students in Data Analytics and Financial Modeling. Bernard also provides consultancy services for SMEs (start-ups and existing) in Financial Management, Business Planning and Research. He has an active audience online with about 17,000 followers on his LinkedIn Account. where he shares tips and tricks on Microsoft Excel and other Office Apps.
Read more about Bernard Obeng Boateng

Right arrow

Data Modeling with Power Pivot – Understanding How to Combine and Analyze Multiple Tables Using the Data Model

In the previous chapters, we went through a lot of concepts to help us understand data modeling and the steps involved in extracting, transforming, and loading data into the data model.

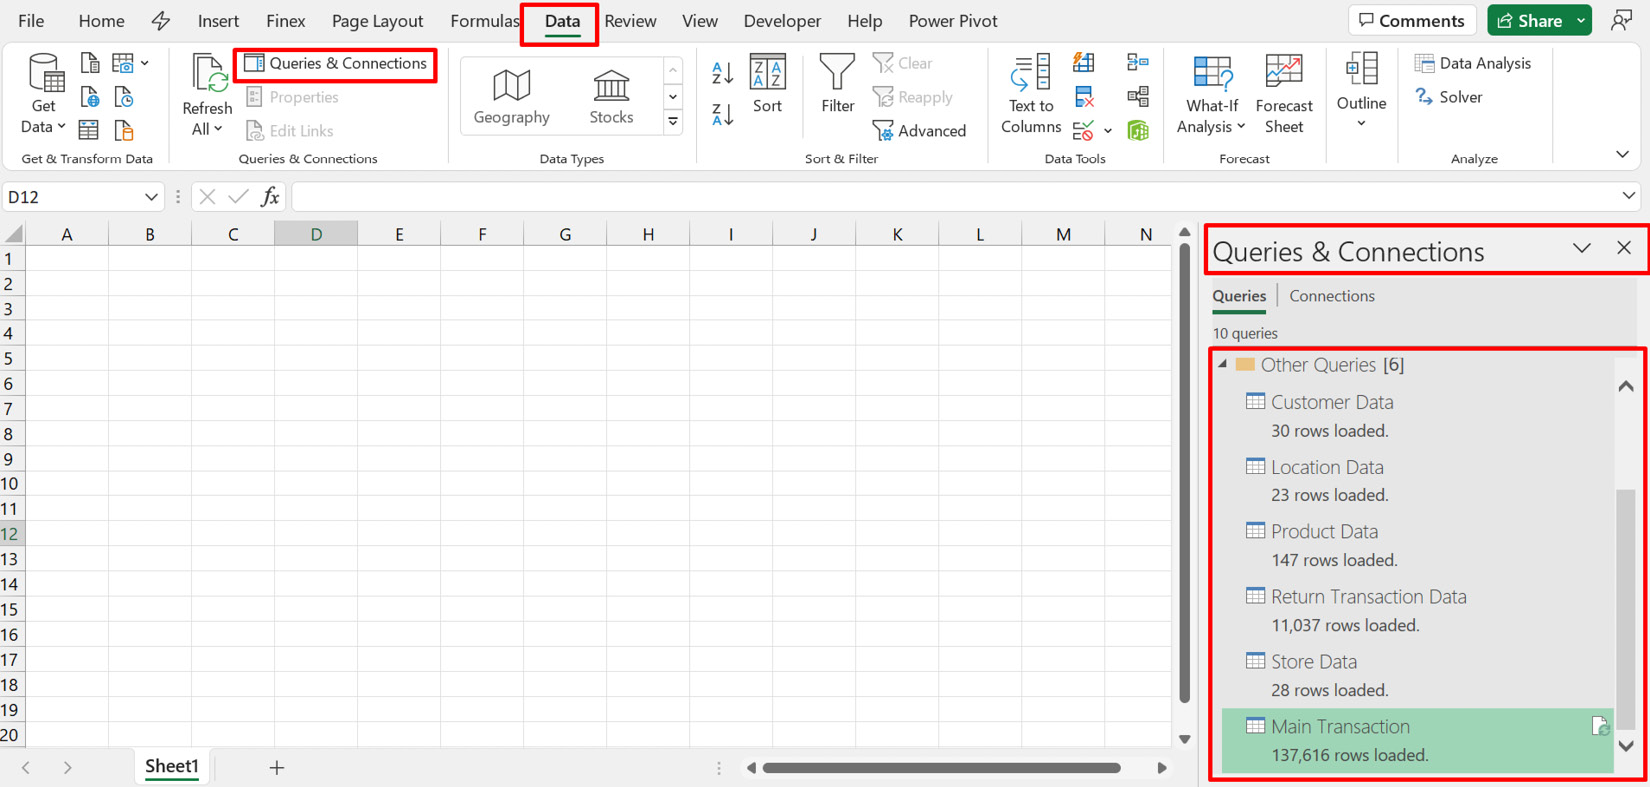
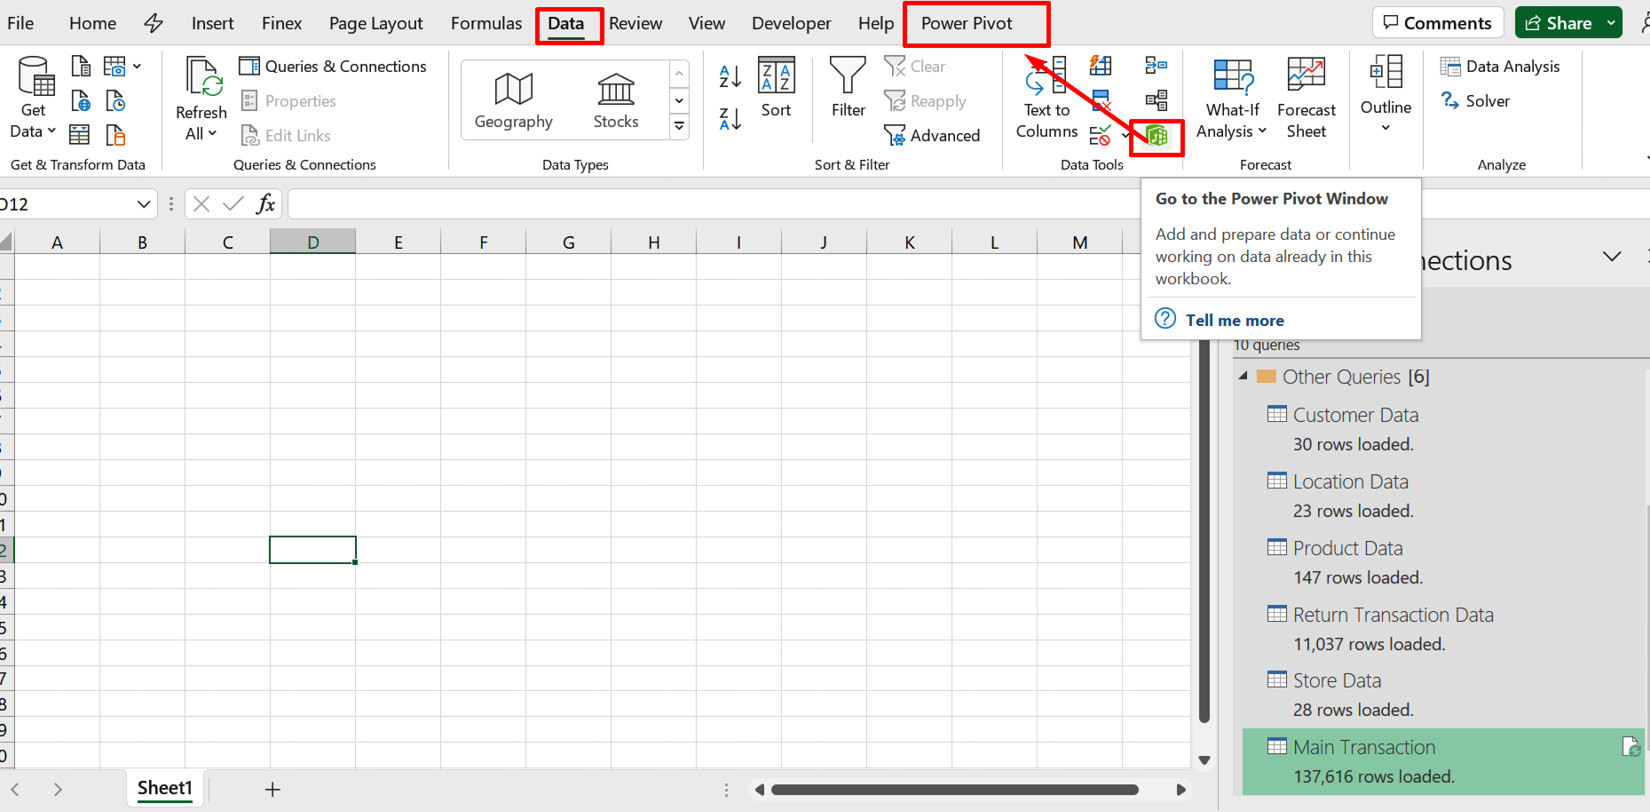
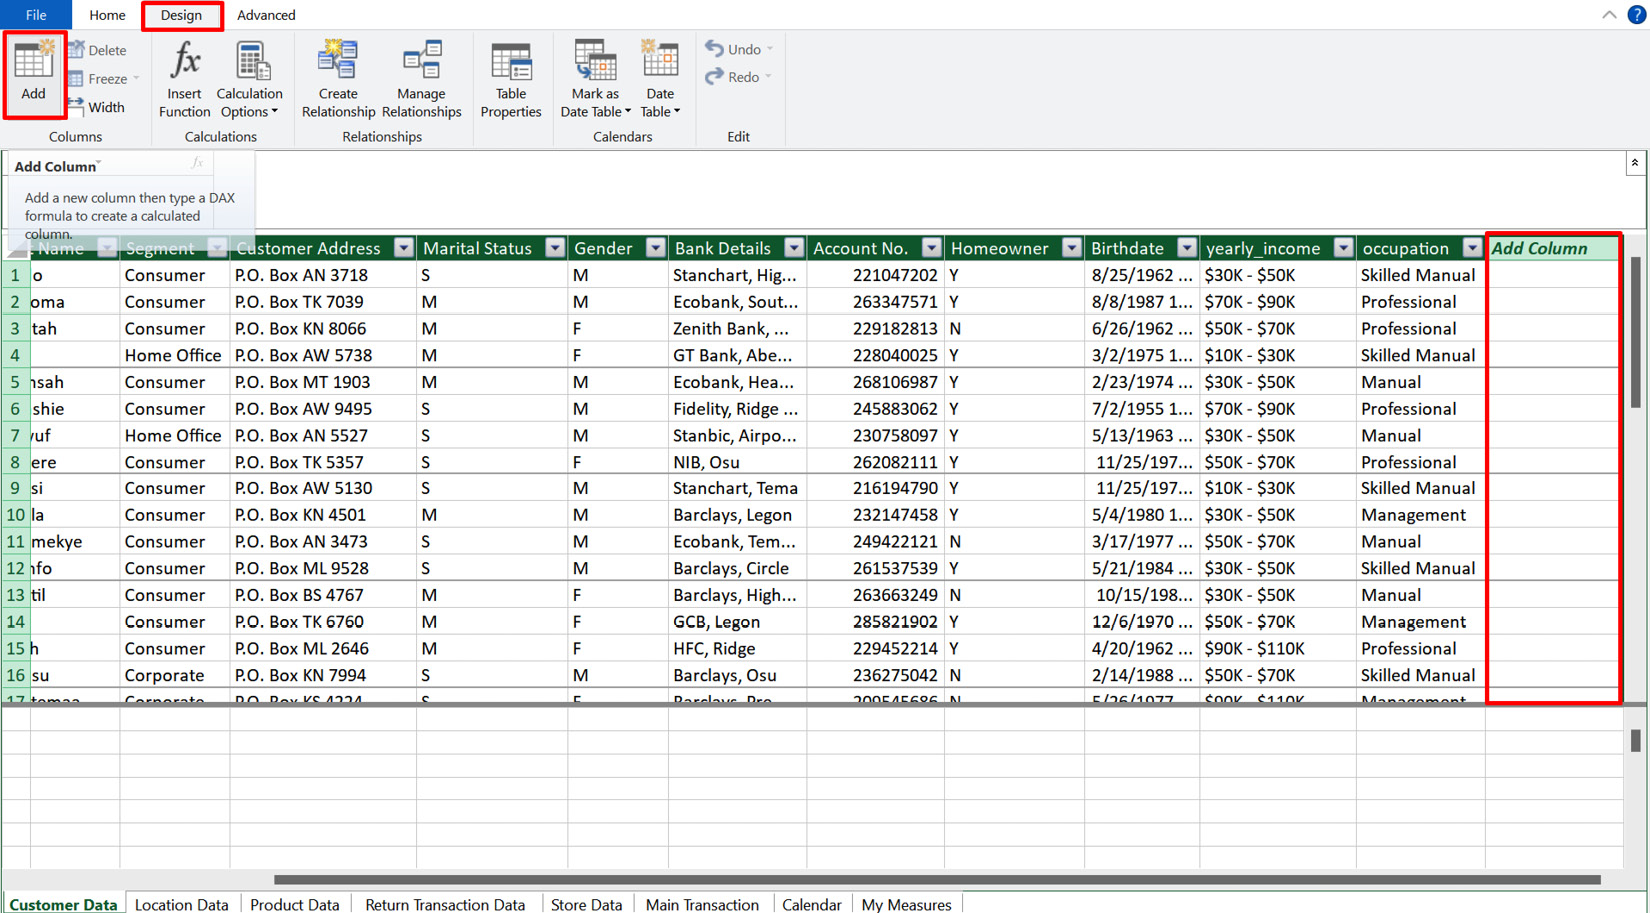
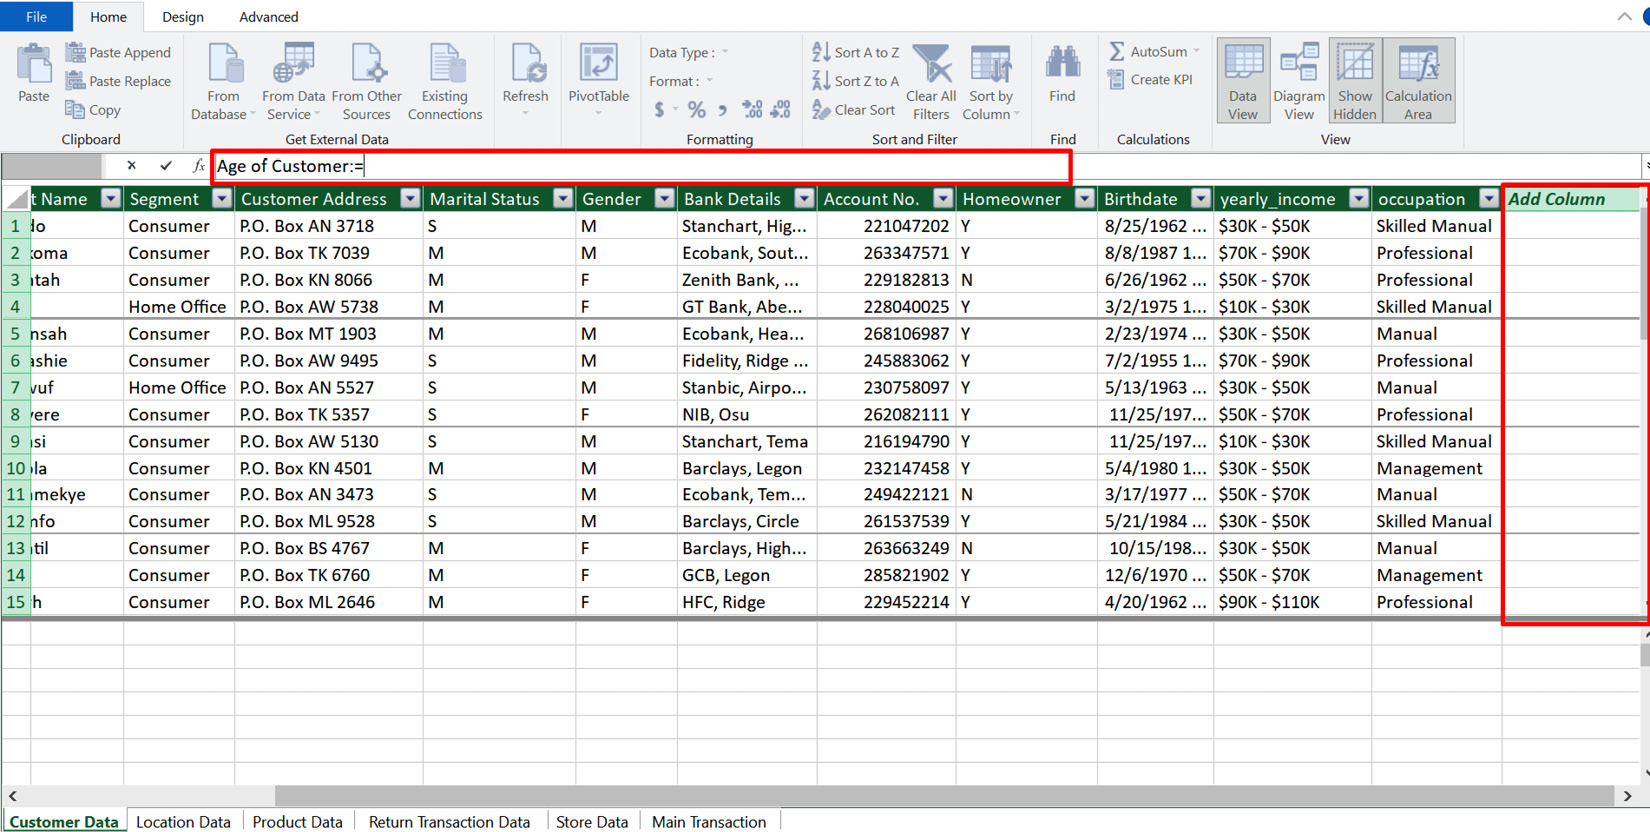
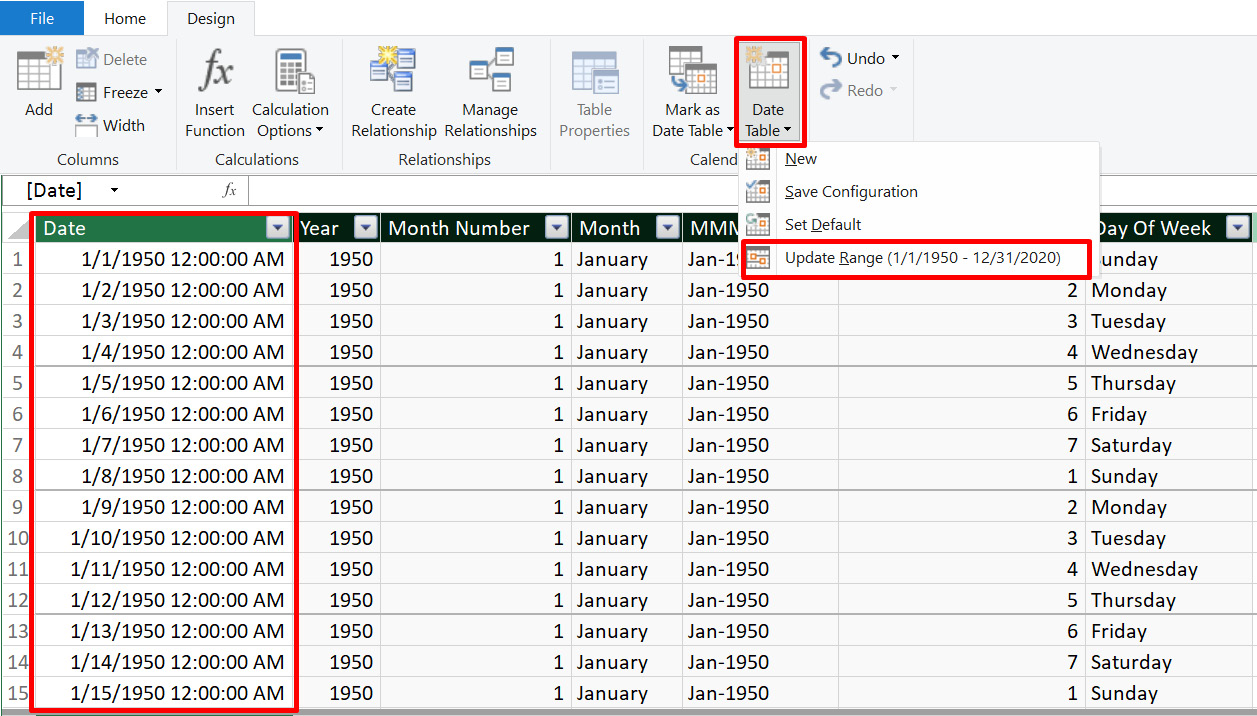
This chapter will now focus on what goes on in Power Pivot after we load our data into the data model. You will learn how to create relationships within the data model, understand the differences between fact and dimension tables, and learn about the roles of primary and foreign keys in the data model. The chapter will also explore the advantages of using relational databases to create a data model for the subsequent calculations in the book.

The following topics will be covered in this chapter:

  • Adding queries/tables to your data model
  • Creating relationships using primary and foreign keys
  • Adding columns to your data model
  • Understanding the different types of...

Adding queries/tables to your data model

In Chapter 3, we concluded our extract, transform, and load (ETL) process by loading our queries into the data model.

Our transformed queries are now stored inside our Excel workbook. To find out where the queries are, you can go to Data | Queries & Connections. This will open the Queries pane to your right, as shown in the following screenshot:

Figure 4.1 – How to display the Queries pane in Microsoft Excel

Figure 4.1 – How to display the Queries pane in Microsoft Excel

Our queries are also stored in the data model. To access the data model, you can go to Data | Data Tools | Go to the Power Pivot Window.

Figure 4.2 – Enabling the Power Pivot tab

Figure 4.2 – Enabling the Power Pivot tab

If you are using Power Pivot for the first time, you will get a message box prompting you to enable Power Pivot. After a few seconds, you should see the Power Pivot tab in your command tabs. You can now open the Power Pivot window by clicking the green cube icon in the Data Tools group...

Adding columns to your data model

Before we start any activity, let us switch to the Design tab in the Power Pivot window. Here, we have some icons that can help us add new columns to our existing data. We can add a new column by selecting the Add icon under the Design menu, which will highlight the last column in our data, or by selecting this column directly.

Figure 4. 9 – Adding a new column in Power Pivot

Figure 4. 9 – Adding a new column in Power Pivot

Let’s try an example of adding a new column to the customer data. We want to calculate the age for each customer as a new column.

To do this, you can go to the Customer tab:

1. Select the last column, which will have Add Column as the header.

2. Type the name of the new column into the formula bar.

3. After selecting the column in the formula bar, begin the formula with the name of the column followed by a colon (:) and an equals sign (=).

Figure 4. 10 – Creating a formula for your calculated column

Figure 4. 10 – Creating a formula for your calculated...

Creating calendar tables

Another useful feature in Power Pivot is the ability to create a dynamic date or calendar table for your data model.

In our Main Transactions table, we have columns that contain dates (the order dates and delivery dates in the Main Transactions table). However, there are gaps or missing dates in these columns. These gaps will not be ideal for us to use some of the time intelligence formulas. We need to create a series of dates that begin from the earliest date in our dataset all the way to the latest date without missing a date.

Power Pivot allows us to create this by using the Date Table feature under the Design tab. This will result in the creation of a new table that contains Date attributes we can use in our calculations.

To do this, go to Design | Date Table | New.

This should give us a date table with different columns, as shown in the following screenshot:

Figure 4.12 – Creating a calendar table in Power Pivot

Figure 4.12 – Creating a calendar table in Power...

Creating relationships using primary and foreign keys

A relationship in a data model is a connection between two entities. Entities are objects that represent real-world things, such as people, places, or things. Relationships can be one-to-one, one-to-many, or many-to-many.

A one-to-one relationship means that each entity in one table is related to exactly one entity in another table. For example, a customer table might have a one-to-one relationship with an address table. Each customer would have exactly one address.

A one-to-many relationship means that each entity in one table can be related to multiple entities in another table. For example, a product table might have a one-to-many relationship with an order table. Each product can be ordered multiple times.

A many-to-many relationship means that each entity in one table can be related to multiple entities in another table and vice versa. For example, a student table might have a many-to-many relationship with a course...

Understanding the different types of schemas (snowflake and star)

When you create a data model, the arrangement of the dimension and fact tables can help you understand how the data flows from the dimension tables to filter the fact tables containing our key measures.

At the heart of our analysis are the key measures we will calculate from our fact tables. These fact tables are normally placed at the lower section of the data model, and our dimension tables are placed on top.

In certain layouts, you can also place the fact tables in the middle surrounded by dimension tables. This type of layout where several dimension tables are connected to one or multiple fact tables placed below or at the center of the dimension tables is called a star schema.

Figure 4.17 – Star schema in a data model

Figure 4.17 – Star schema in a data model

This is a common layout or schema for most data models. It ensures that your calculations are well optimized because it has only dimension tables of one level...

Summary

The chapter introduced you to Power Pivot, the main authoring tool or environment for data modeling in Excel. You have now learned some of the key features in Power Pivot that can help you view all your tables in Diagram View, create relationships between tables, and add calculated columns.

We also covered how we can use Power Pivot to create and modify calendar tables for our data model. You now understand the key differences between dimension and fact tables and the role of primary and foreign keys in creating relationships in the data model.

In the next chapter, we will get hands-on with some DAX measures. The chapter will introduce you to some useful DAX functions and help you master syntax in creating powerful formulas in your data model.

lock icon
The rest of the chapter is locked
You have been reading a chapter from
Data Modeling with Microsoft Excel
Published in: Nov 2023Publisher: PacktISBN-13: 9781803240282
Register for a free Packt account to unlock a world of extra content!
A free Packt account unlocks extra newsletters, articles, discounted offers, and much more. Start advancing your knowledge today.
undefined
Unlock this book and the full library FREE for 7 days
Get unlimited access to 7000+ expert-authored eBooks and videos courses covering every tech area you can think of
Renews at €14.99/month. Cancel anytime

Author (1)

author image
Bernard Obeng Boateng

Bernard Obeng Boateng is a Microsoft Excel MVP, Microsoft Certified Trainer, with over 10 years work experience in Banking, Insurance and Business Development. He is founder of Finex Skills Hub an approved Training Provider of the Financial Modeling Institute, Canada. Finex Skills Hub runs the Finex Project in Ghana, a pro bono student training outreach program for students in Data Analytics and Financial Modeling. Bernard also provides consultancy services for SMEs (start-ups and existing) in Financial Management, Business Planning and Research. He has an active audience online with about 17,000 followers on his LinkedIn Account. where he shares tips and tricks on Microsoft Excel and other Office Apps.
Read more about Bernard Obeng Boateng