Reader small image

You're reading from  Mastering Microsoft Power BI – Second Edition - Second Edition

Product typeBook
Published inJun 2022
PublisherPackt
ISBN-139781801811484
Edition2nd Edition
Right arrow
Authors (2):
Gregory Deckler
Gregory Deckler
author image
Gregory Deckler

Greg Deckler is Vice President of the Microsoft Practice at Fusion Alliance and has been a professional technology systems consultant for over 25 years. Internationally recognized as an expert in Power BI, Greg Deckler is a Microsoft MVP for Data Platform and a superuser within the Power BI community with over 100,000 messages read, more than 11,000 replies, over 2,300 answers, and more than 75 entries in the Quick Measures Gallery. Greg founded the Columbus Azure ML and Power BI User Group (CAMLPUG) and presents at numerous conferences and events, including SQL Saturday, DogFood, and the Dynamic Communities User Group/Power Platform Summit.
Read more about Gregory Deckler

Brett Powell
Brett Powell
author image
Brett Powell

Brett Powell is the owner of and business intelligence consultant at Frontline Analytics LLC, a data and analytics research and consulting firm and Microsoft Power BI partner. He has worked with Power BI technologies since they were first introduced as the PowerPivot add-in for Excel 2010 and has been a Power BI architect and lead BI consultant for organizations across the retail, manufacturing, and financial services industries. Additionally, Brett has led Boston's Power BI User Group, delivered presentations at technology events such as Power BI World Tour, and maintains the popular Insight Quest Microsoft BI blog.
Read more about Brett Powell

View More author details
Right arrow

Waterfall chart

The waterfall chart is one of the most powerful standard visuals in Power BI given its ability to compute and format the variances of individual items between two periods by default.

The items representing the largest variances are displayed as columns of varying length, sorted and formatted with either an increase (green), no change (yellow), or decrease (red) color. This built-in logic and conditional formatting make waterfall charts both easy to create and intuitive for users.

In Figure 7.19, the Internet Net Sales of the last two completed months are broken down by SalesTerritoryCountry:

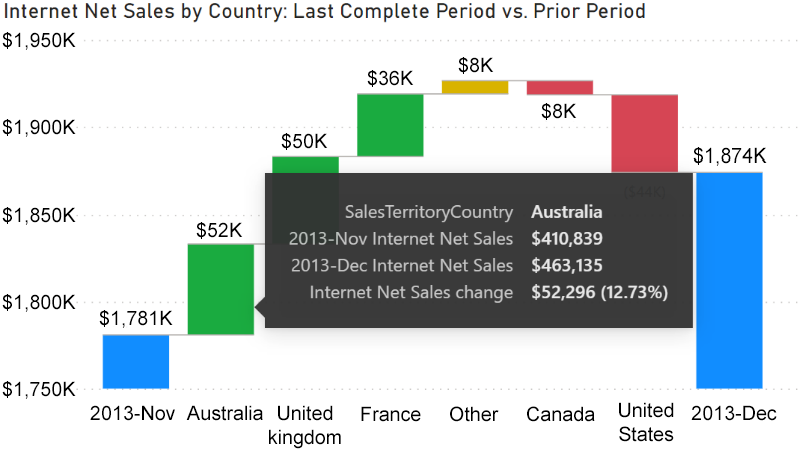
Figure 7.19: Waterfall chart with breakdown

The waterfall chart in Figure 7.19 was created by placing the Internet Net Sales measure applied to the Values field well, and placing the Year Month and SalesTerritoryCountry columns into the Category and Breakdown input fields, respectively. The waterfall chart naturally walks the user from the starting point...

lock icon
The rest of the page is locked
Previous PageNext Page
You have been reading a chapter from
Mastering Microsoft Power BI – Second Edition - Second Edition
Published in: Jun 2022Publisher: PacktISBN-13: 9781801811484

Authors (2)

author image
Gregory Deckler

Greg Deckler is Vice President of the Microsoft Practice at Fusion Alliance and has been a professional technology systems consultant for over 25 years. Internationally recognized as an expert in Power BI, Greg Deckler is a Microsoft MVP for Data Platform and a superuser within the Power BI community with over 100,000 messages read, more than 11,000 replies, over 2,300 answers, and more than 75 entries in the Quick Measures Gallery. Greg founded the Columbus Azure ML and Power BI User Group (CAMLPUG) and presents at numerous conferences and events, including SQL Saturday, DogFood, and the Dynamic Communities User Group/Power Platform Summit.
Read more about Gregory Deckler

author image
Brett Powell

Brett Powell is the owner of and business intelligence consultant at Frontline Analytics LLC, a data and analytics research and consulting firm and Microsoft Power BI partner. He has worked with Power BI technologies since they were first introduced as the PowerPivot add-in for Excel 2010 and has been a Power BI architect and lead BI consultant for organizations across the retail, manufacturing, and financial services industries. Additionally, Brett has led Boston's Power BI User Group, delivered presentations at technology events such as Power BI World Tour, and maintains the popular Insight Quest Microsoft BI blog.
Read more about Brett Powell