Search icon
Arrow left icon
All Products
Best Sellers
New Releases
Books
Videos
Audiobooks
Learning Hub
Newsletters
Free Learning
Arrow right icon
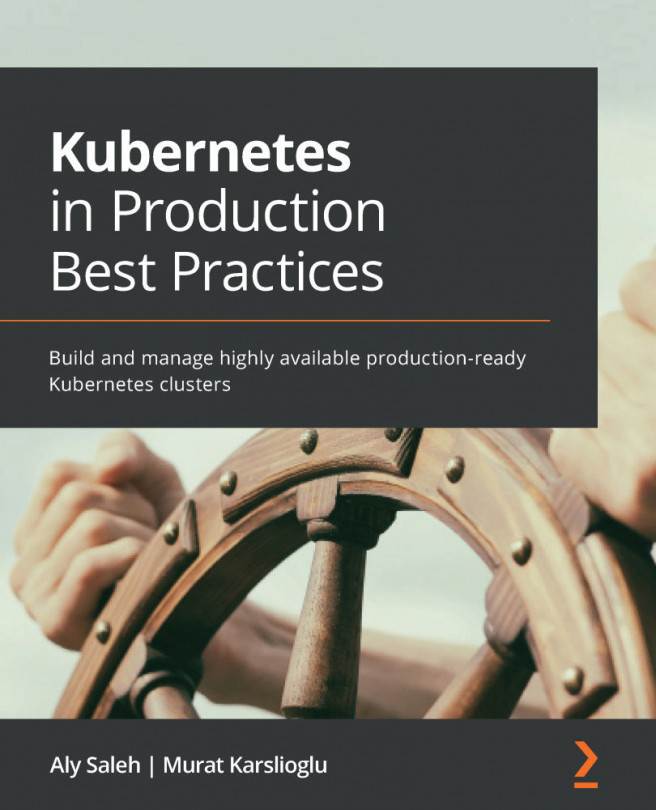
Kubernetes in Production Best Practices

You're reading from  Kubernetes in Production Best Practices

Product type Book
Published in Mar 2021
Publisher Packt
ISBN-13 9781800202450
Pages 292 pages
Edition 1st Edition
Languages
Authors (2):
Aly Saleh Aly Saleh
Profile icon Aly Saleh
Murat Karslioglu Murat Karslioglu
Profile icon Murat Karslioglu
View More author details

Table of Contents (12) Chapters

Preface 1. Chapter 1: Introduction to Kubernetes Infrastructure and Production-Readiness 2. Chapter 2: Architecting Production-Grade Kubernetes Infrastructure 3. Chapter 3: Provisioning Kubernetes Clusters Using AWS and Terraform 4. Chapter 4: Managing Cluster Configuration with Ansible 5. Chapter 5: Configuring and Enhancing Kubernetes Networking Services 6. Chapter 6: Securing Kubernetes Effectively 7. Chapter 7: Managing Storage and Stateful Applications 8. Chapter 8: Deploying Seamless and Reliable Applications 9. Chapter 9: Monitoring, Logging, and Observability 10. Chapter 10: Operating and Maintaining Efficient Kubernetes Clusters 11. Other Books You May Enjoy

Chapter 9: Monitoring, Logging, and Observability

In previous chapters, we learned about application deployment best practices on Kubernetes to modernize our architecture. We learned how Kubernetes creates an abstraction layer on top of a group of container hosts that makes it easier to deploy applications and, at the same time, changes development teams' responsibilities compared to traditional monolithic applications. Adopting microservice architectures requires implementing new observability practices to efficiently monitor the layers introduced by the Kubernetes platform. Whether you plan to expand your existing monitoring stack to include Kubernetes or are looking for a complete cloud-native solution, it is essential to know the critical metrics to monitor and create a strategy to enhance observability to troubleshoot and take effective action when needed.

In this chapter, we will discuss the vital infrastructure components and Kubernetes object metrics. We will understand...

Technical requirements

You should have the following tools installed from previous chapters:

  • kubectl
  • Helm 3
  • metrics-server
  • KUDO Operator
  • cert-manager
  • A Cassandra instance

You need to have an up-and-running Kubernetes cluster as per the instructions in Chapter 3, Provisioning Kubernetes Clusters Using AWS and Terraform.

The code for this chapter is located at https://github.com/PacktPublishing/Kubernetes-in-Production-Best-Practices/tree/master/Chapter09.

Check out the following link to see the Code in Action video:

https://bit.ly/36IMIRH

Understanding the challenges with Kubernetes observability

In this section, we will learn the differences between monitoring and observability from a Kubernetes perspective. We will retain the key metrics we need to monitor to resolve outages quickly. Before discussing the best practices and getting into our monitoring options, let's learn what are considered important metrics in Kubernetes.

Exploring the Kubernetes metrics

When we explored the components of container images in Chapter 8, Deploying Seamless and Reliable Applications, we also compared the monolithic and microservices architectures and learned about the function of a container host. When we containerize an application, our container host (2) needs to run a container runtime (4) and Kubernetes layers (5) on top of our OS to orchestrate scheduling of the Pod. Then our container images are (6) scheduled on Kubernetes nodes. During the scheduling operation, the state of the application running on these new layers...

Learning site reliability best practices

In this section, we will learn about considerations and best practices followed by the industry site reliability experts that handle technical site availability issues when observed.

Site Reliability Engineering (SRE) is a discipline introduced by the Google engineering team. Google's approach of operating their core services at scale still represents a model for SRE best practices today. You can read more about the foundations and practices on the Google SRE resources site at https://sre.google/resources/. Before we learn about the monitoring and metric visualization tools, let's learn about a few common-sense SRE best practices we should consider:

  • Automate everything possible and automate now: SREs should take every opportunity to automate time-consuming infrastructure tasks. As part of a DevOps culture, SREs work with autonomous teams choosing their own services, which makes the unification of tools almost impossible...

Monitoring, metrics, and visualization

In this section, we will learn about popular monitoring solutions in the cloud-native ecosystem and how to get a monitoring stack quickly up and running. Monitoring, logging, and tracing are often misused as interchangeable tools; therefore, understanding each tool's purpose is extremely important.

The most recent 2020 Cloud Native Computing Foundation (CNCF) survey suggests that companies use multiple tools (on average five or more) to monitor their cloud-native services. The list of the popular tools and projects includes Prometheus, OpenMetrics, Datadog, Grafana, Splunk, Sentry, CloudWatch, Lightstep, StatsD, Jaeger, Thanos, OpenTelemetry, and Kiali. Studies suggest that the most common and adopted tools are open source. You can read more about the CNCF community radar observations at https://radar.cncf.io/2020-09-observability.

Prometheus and Grafana used together is the most relevant combined solution for Kubernetes workloads...

Logging and tracing

In this section, we will learn about the popular logging solutions in the cloud-native ecosystem and how to get a logging stack quickly up and running.

Handling logs for applications running on Kubernetes is quite different than traditional application log handling. With monolithic applications, when a server or an application crashes, our server can still retain logs. In Kubernetes, a new pod is scheduled when a pod crashes, causing the old pod and its records to get wiped out. The main difference with containerized applications is how and where we ship and store our logs for future use.

Two cloud-native-focused popular logging stacks are the Elasticsearch, Fluentd, and Kibana (EFK) stack and the Promtail, Loki, and Grafana (PLG) stack. Both have fundamental design and architectural differences. The EFK stack uses Elasticsearch as an object store, Fluentd for log routing and aggregation, and Kibana for the visualization of logs. The PLG stack is based on...

Summary

In this chapter, we explored important Kubernetes metrics and learned about the SRE best practices for maintaining higher availability. We learned how to get a Prometheus and Grafana-based monitoring and visualization stack up and running and added custom application dashboards to our Grafana instance. We also learned how to get Elasticsearch, Kibana, and Fluent Bit-based ECK logging stacks up and running on our Kubernetes cluster.

In the next and final chapter, we will learn about Kubernetes operation best practices. We will cover cluster maintenance topics such as upgrades and rotation, disaster recovery and avoidance, cluster and application troubleshooting, quality control, continuous improvement, and governance.

Further reading

You can refer to the following links for more information on the topics covered in this chapter:

lock icon The rest of the chapter is locked
You have been reading a chapter from
Kubernetes in Production Best Practices
Published in: Mar 2021 Publisher: Packt ISBN-13: 9781800202450
Register for a free Packt account to unlock a world of extra content!
A free Packt account unlocks extra newsletters, articles, discounted offers, and much more. Start advancing your knowledge today.
Unlock this book and the full library FREE for 7 days
Get unlimited access to 7000+ expert-authored eBooks and videos courses covering every tech area you can think of
Renews at €14.99/month. Cancel anytime}