Chapter 7. Data Management
To generate graphs, Cacti needs to collect data. Cacti, by default, comes with some data queries and data input methods, which are enough for small and medium networks, but if you have a large network with 100+ computers, routers, and network devices, writing some data queries and input methods may save you time.
In this chapter, we will learn:
How to create data input method.
How to create data query.
SNMP query XML syntax.
Script query XML syntax.
Creating graph for single SNMP OID.
In Cacti, data is collected by two methods:
1. The data input method.
2. The data query method.
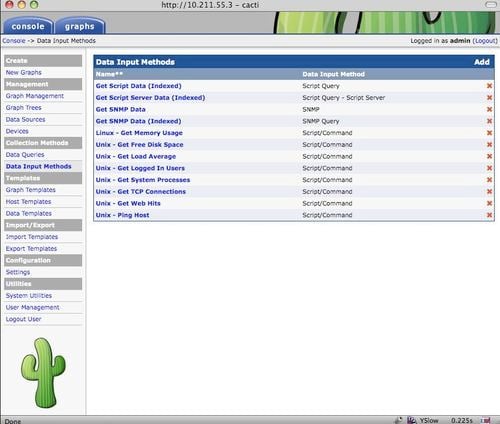
In Chapter 4, we learned about the data input method. Here, we'll learn to create data input methods. Data input methods are the basic system that Cacti uses to collect data for generating graphs.
In the above figure, we can see the list of input methods that come with Cacti. For most small networks, you don't need to add or create a custom data input method. For larger networks...
In Chapter 4, we learned about the data input method. Here, we'll learn to create data input methods. Data input methods are the basic system that Cacti uses to collect data for generating graphs.
In the above figure, we can see the list of input methods that come with Cacti. For most small networks, you don't need to add or create a custom data input method. For larger networks, writing your own data input method may help you as then, you have more control over your graph.
For example, a web server administrator might want to know how many Apache child processes are running. With Cacti, you can show the number of processes on a device without adding any new data input methods. However, if we want to count the instances of a particular process, one option is to create a new data input method. In the following example, we will assume that the process is on the local Cacti box.
To do this, we will use a Perl script. First, create a file called num_process.pl in the Cacti script...
Data queries are not a replacement for data input methods in Cacti. Instead, they provide an easy way to query or list data based upon an index making the data easier to graph. The most common use of a data query within Cacti is to retrieve a list of network interfaces via SNMP. If you want to graph the traffic of a network interface, first Cacti must retrieve a list of interfaces on the host. Second, Cacti can use that information to create the necessary graphs and data sources. Data queries are only concerned with the first step of the process that is obtaining a list of network interfaces and not creating the graphs/data sources for them. While listing network interfaces is a common use for data queries, they also have other uses such as listing partitions, processors, or even cards in a router.
Data queries are not a replacement for data input methods in Cacti. Instead, they provide an easy way to query or list data based upon an index making the data easier to graph. The...
This topic is for advance users only. Here, I am giving an example of an SNMP Query XML.
Here are the details of...
If you need to write Script query XML, here is the syntax:
And here is the detail...
Creating a graph for single SNMP OID
At some point, you may want to generate a graph for a single SNMP OID. In this section, we will learn to create a graph for SNMP OID.
To create a graph for SNMP OID we will use the SNMP Generic OID Template that comes with all Cacti version 0.8.5 and above. Let's start!
Click New Graph from the Create section.
Now, from dropdown menu, select the host where you want to create the graph. From the next dropdown menu, select SNMP Generic OID Template and click on the create button.
In the following page, you will need to fill in the fields.
Fields details of this form: