Reader small image

You're reading from  Machine Learning for Developers

Product typeBook
Published inOct 2017
Reading LevelBeginner
PublisherPackt
ISBN-139781786469878
Edition1st Edition
Languages
Right arrow
Authors (2):
Rodolfo Bonnin
Rodolfo Bonnin
author image
Rodolfo Bonnin

Rodolfo Bonnin is a systems engineer and Ph.D. student at Universidad Tecnolgica Nacional, Argentina. He has also pursued parallel programming and image understanding postgraduate courses at Universitt Stuttgart, Germany. He has been doing research on high-performance computing since 2005 and began studying and implementing convolutional neural networks in 2008, writing a CPU- and GPU-supporting neural network feedforward stage. More recently he's been working in the field of fraud pattern detection with Neural Networks and is currently working on signal classification using machine learning techniques. He is also the author of Building Machine Learning Projects with Tensorflow and Machine Learning for Developers by Packt Publishing.
Read more about Rodolfo Bonnin

View More author details
Right arrow

Linear and Logistic Regression

After the insights we gained by grouping similar information using common features, it's time to get a bit more mathematical and start to search for a way to describe the data by using a distinct function that will condense a large amount of information, and will allow us to predict future outcomes, assuming that the data samples maintain their previous properties.

In this chapter, we will cover the following topics:

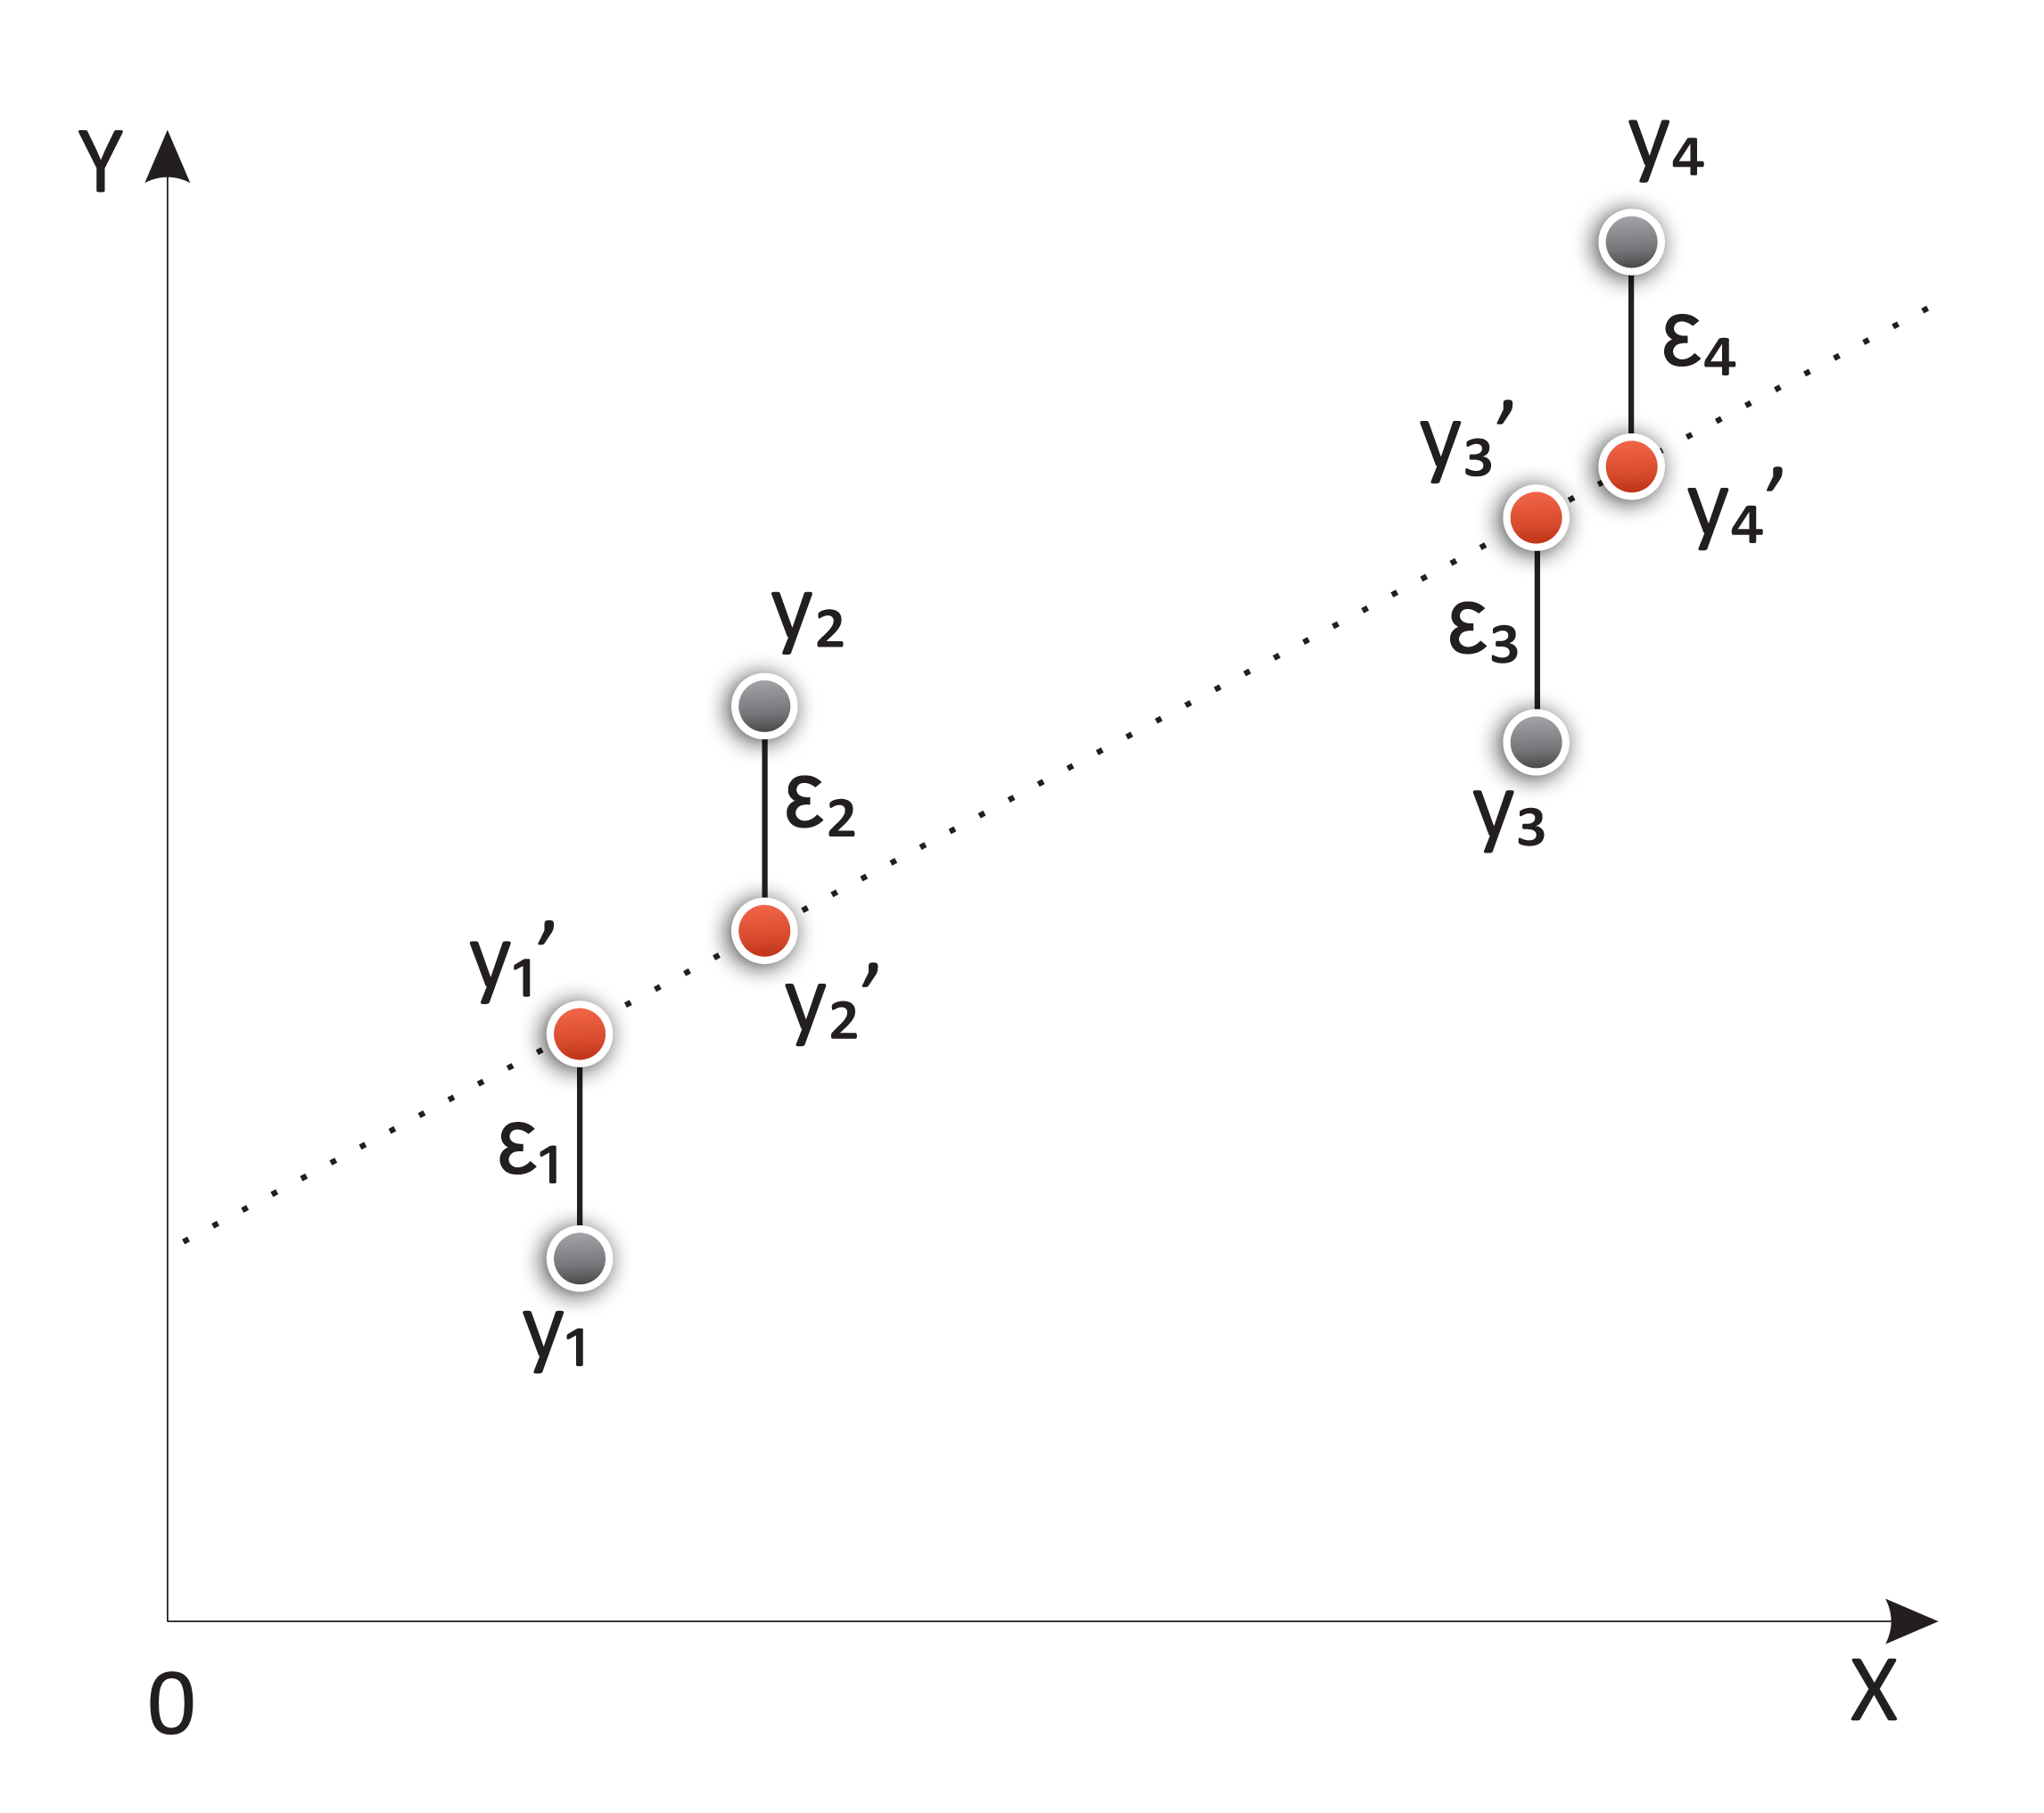
  • Linear regression with a step-by-step implementation
  • Polynomial regression
  • Logistic regression and its implementation
  • Softmax regression

Regression analysis

This chapter will begin with an explanation of the general principles. So, let's ask the fundamental question: what's regression?

Before all considerations, regression is basically a statistical process. As we saw in the introductory section, regression will involve a set of data that has some particular probability distribution. In summary, we have a population of data that we need to characterize.

And what elements are we looking for in particular, in the case of regression? We want to determine the relationship between an independent variable and a dependent variable that optimally adjusts to the provided data. When we find such a function between the described variables, it will be called the regression function.

There are a large number of function types available to help us model our current data, the most common example being the linear, polynomial...

Linear regression

So, it's time to start with the simplest yet still very useful abstraction for our data–a linear regression function.

In linear regression, we try to find a linear equation that minimizes the distance between the data points and the modeled line. The model function takes the following form:

yi = ßxi +α+εi

Here, α is the intercept and ß is the slope of the modeled line. The variable x is normally called the independent variable, and y the dependent one, but it can also be called the regressor and the response variables.

The εi variable is a very interesting element, and it's the error or distance from the sample i to the regressed line.

Depiction of the components of a regression line, including the original elements, the estimated ones (in red), and the error (ε)

The set of all those distances, calculated...

Data exploration and linear regression in practice

In this section, we will start using one of the most well-known toy datasets, explore it, and select one of the dimensions to learn how to build a linear regression model for its values.
Let's start by importing all the libraries (scikit-learn, seaborn, and matplotlib); one of the excellent features of Seaborn is its ability to define very professional-looking style settings. In this case, we will use the whitegrid style:

import numpy as np from sklearn import datasets import seaborn.apionly as sns %matplotlib inline import matplotlib.pyplot as plt sns.set(style='whitegrid', context='notebook')

The Iris dataset

It’s time to load the Iris dataset...

Logistic regression

The way of this book is one of generalizations. In the first chapter, we began with simpler representations of the reality, and so simpler criteria for grouping or predicting information structures.

After having reviewed linear regression, which is used mainly to predict a real value following a modeled linear function, we will advance to a generalization of it, which will allow us to separate binary outcomes (indicating that a sample belongs to a class), starting from a previously fitted linear function. So let's get started with this technique, which will be of fundamental use in almost all the following chapters of this book.

Problem domain of linear regression and logistic regression

To intuitively...

Summary

In this chapter, we've reviewed the main ways to approach the problem of modeling data using simple and definite functions.

In the next chapter, we will be using more sophisticated models that can reach greater complexity and tackle higher-level abstractions, and can be very useful for the amazingly varied datasets that have emerged recently, starting with simple feedforward networks.

References

Galton, Francis, "Regression towards mediocrity in hereditary stature." The Journal of the Anthropological Institute of Great Britain and Ireland 15 (1886): 246-263.

Walker, Strother H., and David B. Duncan, "Estimation of the probability of an event as a function of several independent variables." Biometrika 54.1-2 (1967): 167-179.

Cox, David R, "The regression analysis of binary sequences." Journal of the Royal Statistical Society. Series B (Methodological)(1958): 215-242.

lock icon
The rest of the chapter is locked
You have been reading a chapter from
Machine Learning for Developers
Published in: Oct 2017Publisher: PacktISBN-13: 9781786469878
Register for a free Packt account to unlock a world of extra content!
A free Packt account unlocks extra newsletters, articles, discounted offers, and much more. Start advancing your knowledge today.
undefined
Unlock this book and the full library FREE for 7 days
Get unlimited access to 7000+ expert-authored eBooks and videos courses covering every tech area you can think of
Renews at $15.99/month. Cancel anytime

Authors (2)

author image
Rodolfo Bonnin

Rodolfo Bonnin is a systems engineer and Ph.D. student at Universidad Tecnolgica Nacional, Argentina. He has also pursued parallel programming and image understanding postgraduate courses at Universitt Stuttgart, Germany. He has been doing research on high-performance computing since 2005 and began studying and implementing convolutional neural networks in 2008, writing a CPU- and GPU-supporting neural network feedforward stage. More recently he's been working in the field of fraud pattern detection with Neural Networks and is currently working on signal classification using machine learning techniques. He is also the author of Building Machine Learning Projects with Tensorflow and Machine Learning for Developers by Packt Publishing.
Read more about Rodolfo Bonnin