

Debugging C++ Code
There are different levels of problems that you can come across while developing a C++ project:
- First, you may receive compiler errors. These can happen because of a mistake you made in syntax, or a wrong choice for a type, and so on. The compiler is the first hoop you have to jump through, and it catches some mistakes you may have made.
- The second hoop is the linker. There, a typical mistake is to use something that is declared, but not actually defined. This happens often when you use the wrong header file for a library—the header file advertises a certain signature that does not exist in any of the source files or libraries. Once you also jump through the linker hoop, your program is ready to execute.
- Now, the next hoop to jump through is to avoid any runtime errors. Your code may have compiled and linked properly, but it may be doing things that do not work, such as dereferencing a null pointer or dividing by zero.
To find and fix runtime errors, you have to interact with and monitor the running application in some way. An often-used technique is to add print statements to the code and monitor the logs that it generates, hoping to correlate the application behavior with the logs to pinpoint the region in code that has the problem. While this works for some cases, sometimes you need to take a closer look at the execution.
A debugger is a better tool to fight runtime errors. A debugger can let you run code line by line, continue running and pause on the lines that you want, investigate the values of memory, and pause on errors, among other things. This lets you watch what exactly is going on with memory as your program is running and identify the line of code that results in the unwanted behavior.
gdb is the canonical command-line debugger that can debug C++ programs. However, it may be difficult to use as debugging is inherently a visual task—you want to be able to look at lines of code, values of variables, and the output of the program at the same time. Luckily, Eclipse CDT includes a visual debugger that is easy to use.
Exercise 9: Debugging with Eclipse CDT
You have been simply running your projects and viewing the output. Now you want to learn how to debug your code in detail. In this exercise, we will explore Eclipse CDT's debugging capabilities. Perform the following steps to complete the exercise:
- Open the CMake project in Eclipse CDT.
- To ensure that we have an existing run configuration, click Run | Run Configurations. There, you should see a CxxTemplate entry under C/C++ Application.
Note
Since we ran our project before, it should be there. If not, please go back and create it again.
- Close the dialog box to continue.
- To start the debugger, find the toolbar entry that looks like an insect (bug) and click on the dropdown next to it. Select CxxTemplate to debug the main application. If it asks you to switch to the debug perspective, accept. Now, this is what Eclipse will look like:

Figure 1.47: Eclipse debug screen
At the moment, our code froze at the very first line of our main() function, which is shown with the green highlight and the arrow in the center code view. On the left, we see the running threads, of which there is only one. On the right, we see the variables that are accessible in this context. On the bottom, we see the gdb output that Eclipse uses behind the scenes to actually debug the executable. Now, there is not much to be debugged with our main function.
- Click Step Over either under the Run menu or in the toolbar a couple of times and see that the application will terminate soon. In the end, you will see the libc-start.c library, which is the caller of the main function. You can close it and switch to your source files when done. When you do not see the red stop button anymore, you know that the program execution is over.
- Edit our main function by adding the following code:
int i = 1, t = 0;
do {
t += i++;
} while (i <= 3);
std::cout << t << std::endl;
The post-increment operator mixed with the occasional do-while loop can be a head-scratcher for some. This is because we try to execute the algorithm in our heads. However, our debugger is perfectly able to run it step by step and show us what exactly happens during execution.
- Start debugging after adding the preceding code. Click on the dropdown next to the Debug button in the toolbar and select CxxTemplate. Press F6 a couple of times to step over in the code. It will show us how the variables change as well as the line of code that will be executed next:

Figure 1.48: Stepping over the code
- Seeing the variables change after the execution of each line of code makes the algorithm much clearer to understand. As you press F6, note that the following are the values after each execution of the t += i++; line:

Figure 1.49: Variable states through time
The preceding output clearly explains how the values are changing and why 6 is printed at the end.
- Explore other features of the debugger. While the variable view is useful, you can also hover over any variable and browse its value:

Figure 1.50: View option of the debugger
Furthermore, the Expression view helps you calculate things that are otherwise not clear from the values that you browse.
- Click on Expression on the right-hand side and click on the Add button:

Figure 1.51: Adding an expression
- Type t+i and hit Enter. Now you see the total in the list of expressions:

Figure 1.52: Expression view with a new expression
You can press the red square in the toolbar or select Run | Terminate to stop debugging at any time. Another feature is breakpoints, which tell the debugger to pause whenever it goes to a line marked with a breakpoint. So far, we have been stepping through our code line by line, which may be very time-consuming in a large project. Instead, you usually want to continue the execution until it arrives at the code that you are interested in.
- Now, instead of going line by line, add a breakpoint in the line that does the printing. For this, double-click on the area to the left of the line number of this line. In the following figure, the dot represents a breakpoint:

Figure 1.53: Workin with breakpoints
- Now start the debugger. As usual, it will start paused. Now select Run | Resume or click on the toolbar button. It will run the three executions of the loop and pause at our breakpoint. This way, we saved time by stepping through code that we are not investigating:

Figure 1.54: Working with the debugger
- While we have been dealing with the loop that we added, we ignored the line that creates an app object. The Step Over command was skipping this line. However, we also have the option to go into the constructor call that is in this line. For that, we will use Run | Step Into or the corresponding toolbar button.
- Stop the debugger and start it again. Click on Step Over to go to the line where the application is created:

Figure 1.55: Working with the debugger – the Step Over option
- The highlighted is the next line that would be executed if we step over again. Instead, press the Step Into button. This will take us into the constructor call:
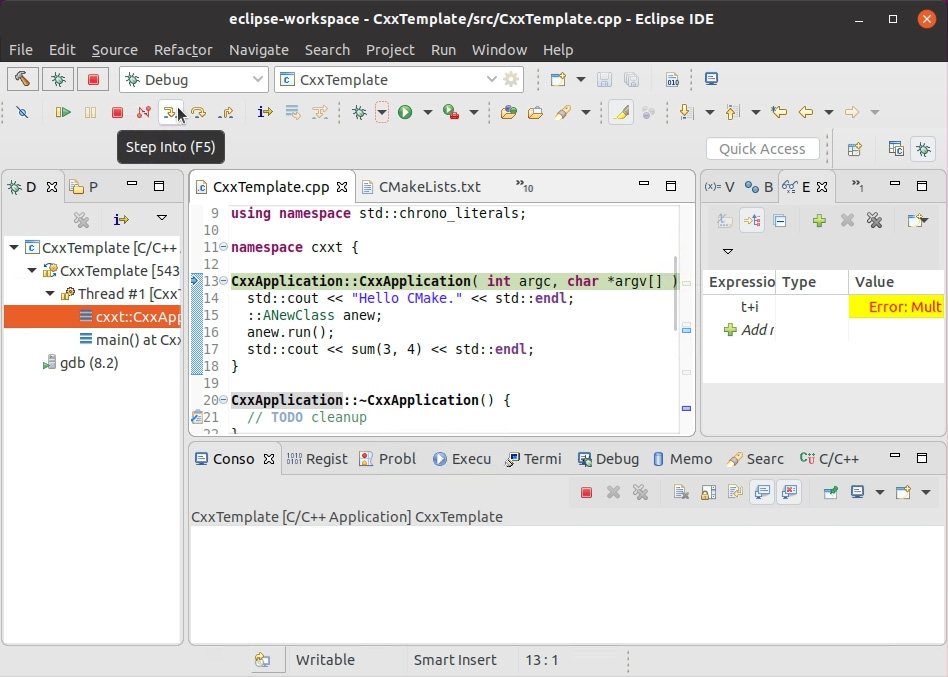
Figure 1.56: Working with the debugger – the Step Into option
This is a handy feature for diving deeper into the function instead of simply stepping over it. Also, notice the call stack in the left debug view. You can always click on the lower entries to go and view the callers' contexts again.
This was a brief introduction to the Eclipse CDT debugger, which uses GDB under the hood to give you a visual debugging experience. You may find debugging useful when trying to understand runtime errors better and correcting the mistakes that caused them.