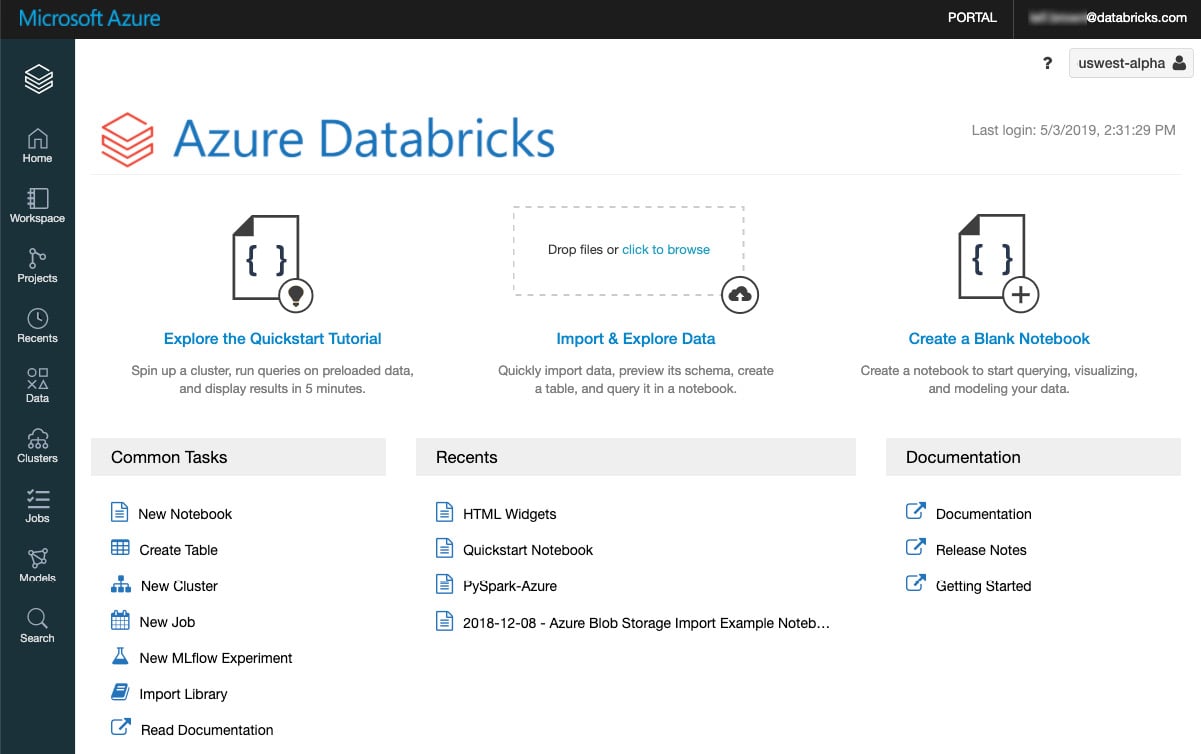
In this section, we will describe the basics of working with notebooks within Azure Databricks.
Creating and managing notebooks
There are different ways to interact with notebooks in Azure Databricks. We can either access them through the UI using CLI commands, or by means of the workspace API. We will focus on the UI for now:
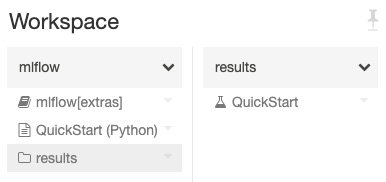
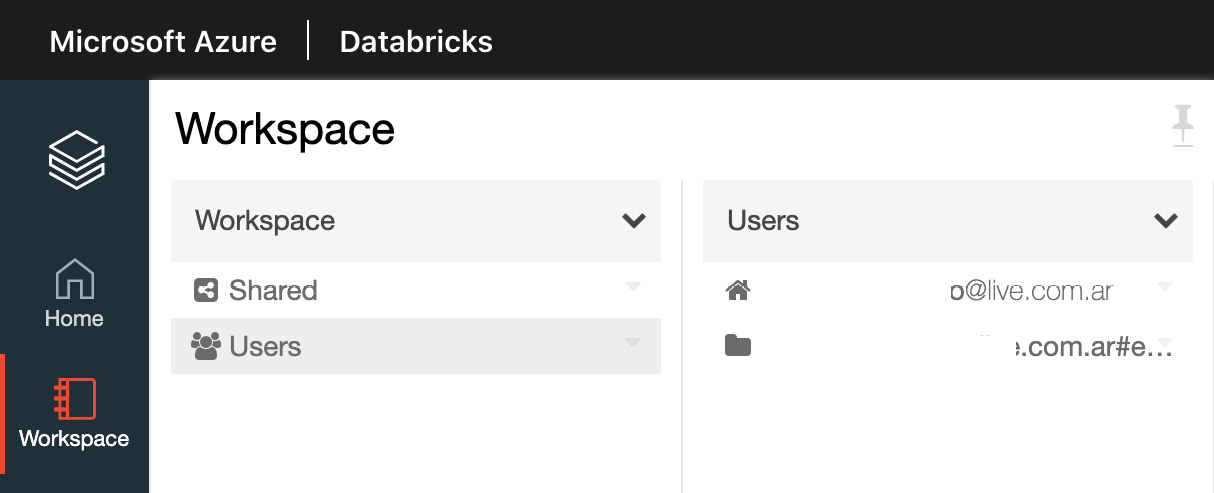
- By clicking on the Workspace or Home button in the sidebar, select the drop-down icon next to the folder in which we will create the notebook. In the Create Notebook dialog, we will choose a name for the notebook and select the default language:
Figure 1.10 – Creating a new notebook
- Running clusters will show notebooks attached to them. We can select one of them to attach the new notebook to; otherwise, we can attach it once the notebook has been created in a specific location.
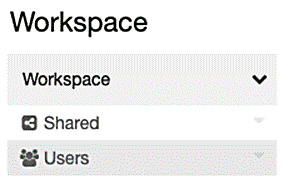
- To open a notebook, in your workspace, click on the icon corresponding to the notebook you want to open. The notebook path will be displayed when you hover over the notebook title.
Note
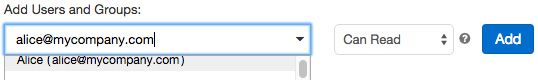
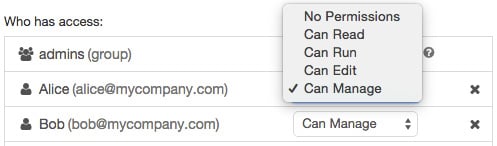
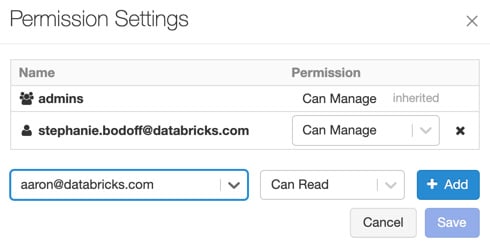
If you have an Azure Databricks Premium plan, you can apply access control to the workspace assets.
External notebook formats
Azure Databricks supports several notebook formats, which can be scripts in one of the supported languages (Python, Scala, SQL, and R), HTML documents, DBC archives (Databricks native file format), IPYNB Jupyter notebooks, and R Markdown documents.
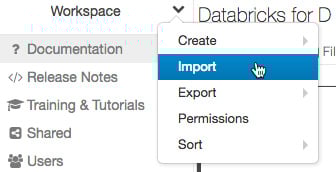
Importing a notebook
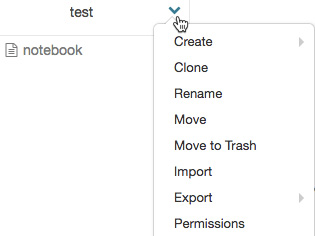
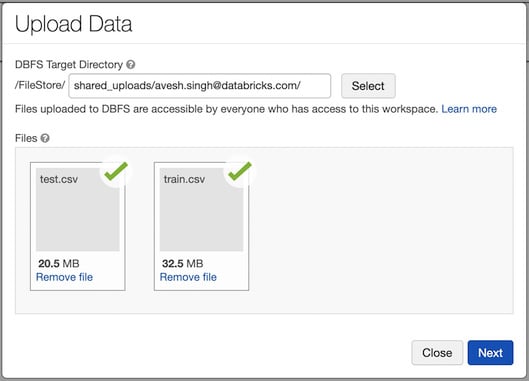
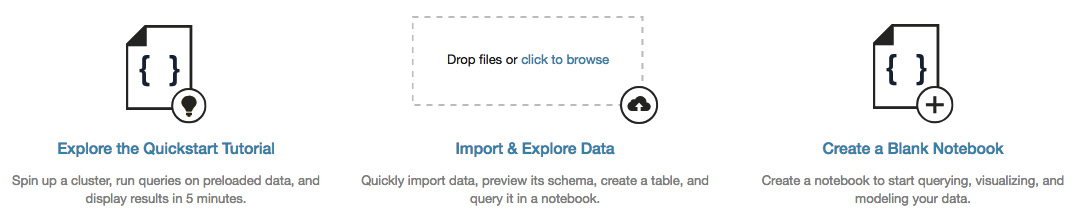
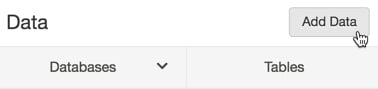
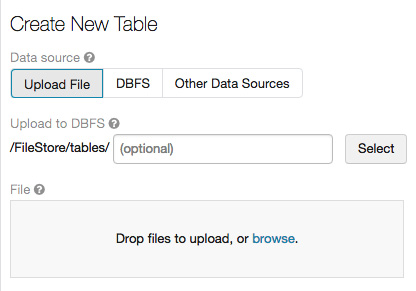
We can import notebooks into the Azure workspace by clicking in the drop-down menu and selecting Import. After this, we can specify either a file or a URL that contains the file in one of the supported formats and then click Import:
Figure 1.11 – Importing a notebook into the workspace
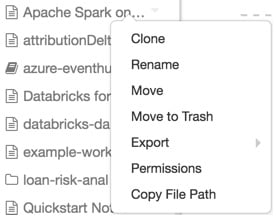
Exporting a notebook
You can export a notebook in one of the supported file formats by clicking on the File button in the notebook toolbar and then selecting Export. Bear in mind that the results of each cell will be included if you have not cleared them.
Notebooks and clusters
To be able to work, a notebook needs to be attached to a running cluster. We will now learn about how notebooks connect to the clusters and how to manage these executions.
Execution contexts
When a notebook is attached to a cluster, a read-eval-print-loop (REPL) environment is created. This environment is specific to each one of the supported languages and is contained in an execution context.
There is a limit of 145 execution contexts running in a single cluster. Once that number is reached, you cannot attach any more notebooks to that cluster or create a new execution context.
Idle execution contexts
If an execution context has passed a certain time threshold without any executions, it is considered idle and automatically detached from the notebook. This threshold is, by default, 25 hours.
One thing to consider is that when a cluster reaches its maximum context limit, Azure Databricks will remove the least recently used idle execution contexts. This is called an eviction.
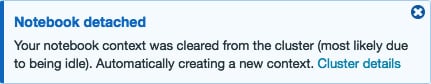
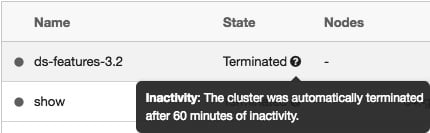
If a notebook gets evicted from the cluster it was attached to, the UI will display a message:
Figure 1.12 – Detached notebook notification
We can configure this behavior when creating the cluster or we can disable it by setting the following:
spark.databricks.chauffeur.enableIdleContextTracking false
Attaching a notebook to a cluster
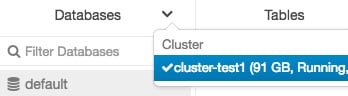
Notebooks are attached to a cluster by selecting one from the drop-down menu in the notebook toolbar.
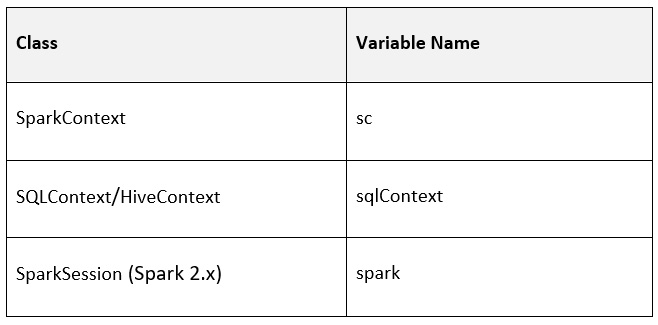
A notebook attached to a running cluster has the following Spark environment variables by default:
Figure 1.13 – A table showing Spark environment variables
We can check the Spark version running in the cluster where the notebook is attached by running the following Python code in one of the cells:
spark.version
We can also see the current Databricks runtime version with the following command:
spark.conf.get("spark.databricks.clusterUsageTags.sparkVersion")
These properties are required by the Clusters and Jobs APIs to communicate between themselves.
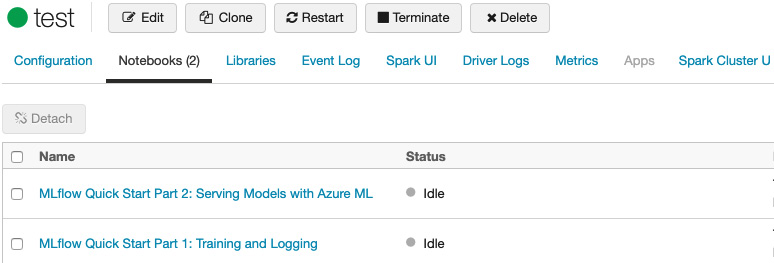
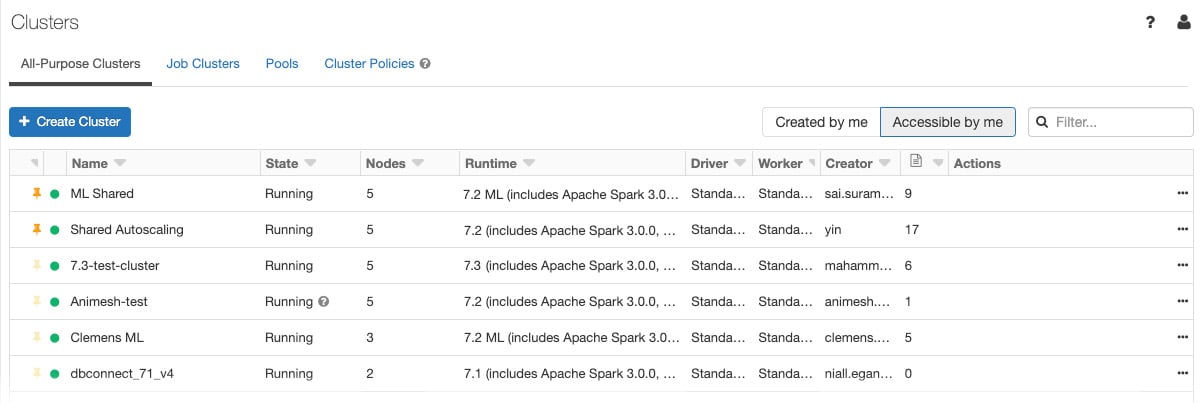
On the cluster details page, the Notebooks tab will show all the notebooks attached to the cluster, as well as the status and the last time it was used:
Figure 1.14 – Notebooks attached to a cluster
Attaching a notebook to a cluster is necessary in order to make them work; otherwise, we won't be able to execute the code in it.
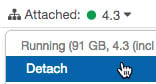
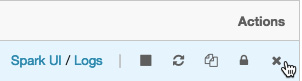
Notebooks are detached from a cluster by clicking in the currently attached cluster and selecting Detach:
Figure 1.15 – Detaching a notebook from a cluster
This causes the cluster to lose all the values stored as variables in that notebook. It is good practice to always detach the notebooks from the cluster once we have finished working on them. This prevents the autostopping of running clusters, in case there is a process running in the notebook (which could cause undesired costs).
Scheduling a notebook
As mentioned before, notebooks can be scheduled to be executed periodically. To schedule a notebook job to run periodically, click the Schedule button at the top right of the notebook toolbar.
A notebook's core functionalities
Now, we'll look at how you can use a notebook.
Notebook toolbar
Notebooks have a toolbar that contains information on the cluster to which it is attached, and to perform actions such as exporting the notebook or changing the predefined language (depending on the Databricks runtime version):
Figure 1.16 – Notebook toolbar
This toolbar helps us to navigate the general options in our notebook and makes it easier to manage how we interact with the computation cluster.
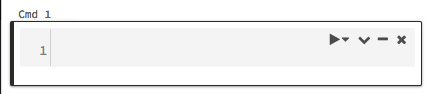
Cells
Cells have code that can be executed:
Figure 1.17 – Execution cells
At the top-left corner of a cell, in the cell actions, you have the following options: Run this cell, Dashboard, Edit, Hide, and Delete:
- You can use the Undo keyboard shortcut to restore a deleted cell by selecting Undo Delete Cell from Edit.
- Cells can be cut using cell actions or the Cut keyboard shortcut.
- Cells are added by clicking on the Plus icon at the bottom of each cell or by selecting Add Cell Above or Add Cell Below from the cell menu in the notebook toolbar.
Running cells
Specific cells can be run from the cell actions toolbar. To run several cells, we can choose between Run all, all above, or all below. We can also select Run All, Run All Above, or Run All Below from the Run option in the notebook toolbar. Bear in mind that Run All Below includes the cells you are currently in.
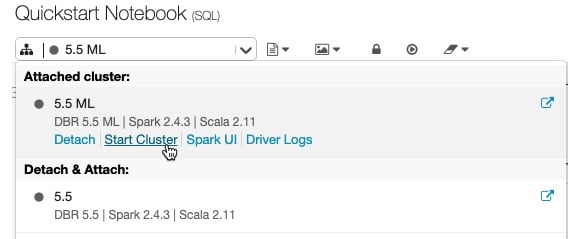
Default language
The default language for each notebook is shown in parentheses next to the notebook name, which, in the following example, is SQL:
Figure 1.18 – Cell default language
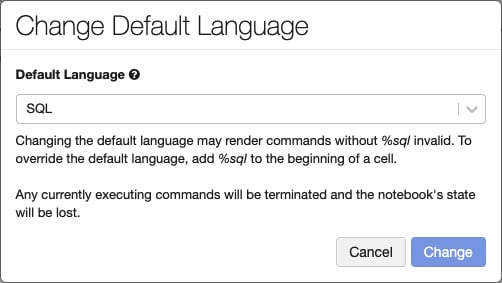
If you click the name of the language in parentheses, you will be prompted by a dialog box in which you can change the default language of the notebook:
Figure 1.19 – Changing the default language of a cell
When the default language is changed, magic commands will be added to the cells that are not in the new default language in order to keep them working.
The language can also be specified in each cell by using the magic commands. Four magic commands are supported for language specification: %python, %r, %scala, and %sql.
There are also other magic commands such as %sh, which allows you to run shell code; %fs to use dbutils filesystem commands; and %md to specify Markdown, for including comments and documentation. We will look at this in a bit more detail.
Including documentation
Markdown is a lightweight markup language with plain text-formatting syntax, often used for formatting readme files, which allows the creation of rich text using plain text.
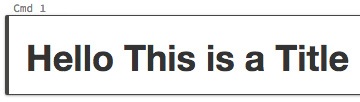
As we have seen before, Azure Databricks allows Markdown to be used for documentation by using the %md magic command. The markup is then rendered into HTML with the desired formatting. For example, the next code is used to format text as a title:
%md # Hello This is a Title
It is rendered as an HTML title:
Figure 1.20 – Markdown title
Documentation blocks are one of the most important features of Azure Databricks notebooks. They allow us to state the purpose of our code and how we interpret our results.
Command comments
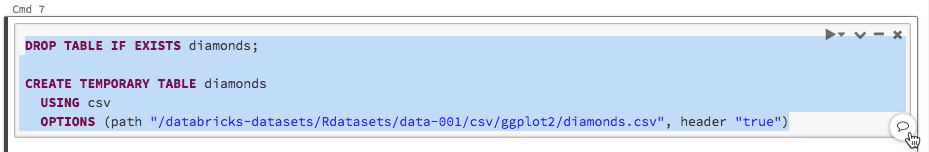
Users can add comments to specific portions of code by highlighting it and clicking on the comment button in the bottom-right corner of the cell:
Figure 1.21 – Selecting a portion of code
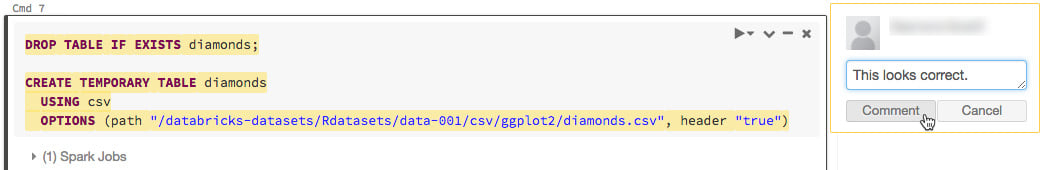
This will prompt a textbox in which we can place comments to be reviewed by other users. Afterward, the commented text will be highlighted:
Figure 1.22 – Commenting on the selection
Comments allow us to propose changes or require information on specific portions of the notebook without intervening in the content.
Downloading a cell result
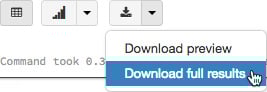
You can download the tabular results from a cell to your local machine by clicking on the download button at the bottom of a cell:
Figure 1.23 – Downloading full results from a cell
By default, Azure Databricks limits you to viewing 1,000 rows of a DataFrame, but if there is more data present, we can click on the drop-down icon and select Download full results to see more.
Formatting SQL
Formatting SQL code can take up a lot of time, and enforcing standards across notebooks can be difficult.
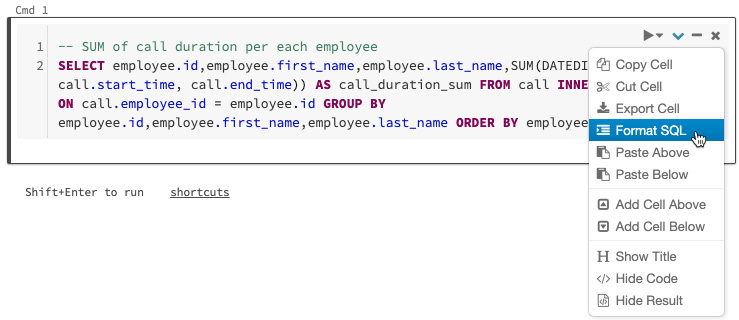
Azure Databricks has a functionality for formatting SQL code in notebook cells, so as to reduce the amount of time dedicated to formatting code, and also to help in applying the same coding standards in all notebooks. To apply automatic SQL formatting to a cell, you can select it from the cell context menu. This is only applicable to SQL code cells:
Figure 1.24 – Automatic formatting of SQL code
Applying the autoformatting of SQL code is a feature that can improve the readability of our code, and reduce possible mistakes due to bad formatting.
 Argentina
 Australia
 Austria
 Belgium
 Brazil
 Bulgaria
 Canada
 Chile
Chile
 Colombia
 Cyprus
 Czechia
 Denmark
 Ecuador
 Egypt
Egypt
 Estonia
 Finland
 France
 Germany
 Great Britain
 Greece
 Hungary
 India
India
 Indonesia
 Ireland
 Italy
Italy
 Japan
Japan
 Latvia
 Lithuania
 Luxembourg
 Malaysia
 Malta
Malta
 Mexico
 Netherlands
 New Zealand
 Norway
 Philippines
 Poland
 Portugal
 Romania
 Russia
 Singapore
 Slovakia
 Slovenia
 South Africa
 South Korea
 Spain
Spain
 Sweden
 Switzerland
 Taiwan
 Thailand
 Turkey
 Ukraine
 United States