Search icon
Arrow left icon
All Products
Best Sellers
New Releases
Books
Videos
Audiobooks
Learning Hub
Newsletters
Free Learning
Arrow right icon
Mastering Data Visualization with Microsoft Visio Professional 2016

You're reading from  Mastering Data Visualization with Microsoft Visio Professional 2016

Product type Book
Published in May 2016
Publisher Packt
ISBN-13 9781785882661
Pages 334 pages
Edition 1st Edition
Languages
Authors (2):
John Marshall John Marshall
David Parker David Parker
Profile icon David Parker
View More author details

Table of Contents (17) Chapters

Mastering Data Visualization with Microsoft Visio Professional 2016
Credits
About the Author
www.PacktPub.com
Preface
1. Data within Visio Essentials 2. Understanding How Data Is Stored within Visio 3. Linking Data to Shapes 4. Using the Built-In Data Graphics 5. Using the Pivot Diagram Add-On 6. Creating Custom Master Shapes 7. Creating Custom Data Graphics 8. Validating and Extracting Information 9. Automating Structured Diagrams 10. Sharing Data Diagrams 11. Choosing a Deployment Methodology Index

Chapter 5. Using the Pivot Diagram Add-On

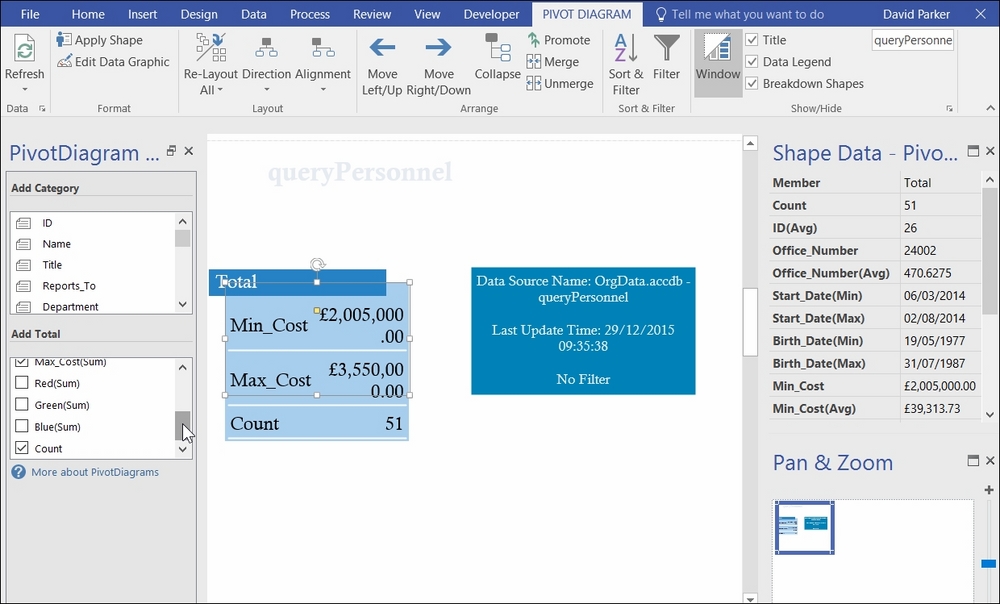
Most Microsoft Excel users are familiar with Pivot Tables and Pivot Charts. These features provide the ability to group and aggregate data numerically and visually. Visio provides a similar ability with the Pivot Diagram add-on, through which data can be grouped and aggregated with connected shapes. The shapes can then be enhanced with Data Graphics to provide a rich representation of the information in them.

The Pivot Diagram is an add-on, so there is no programmable interface for it, but it does provide a nice way of producing a breakdown diagram. It shares some features with the Link Data feature and can optionally be mashed together with it, thus turning it into a semi-refreshable information dashboard.

In this chapter, we shall cover the following topics:

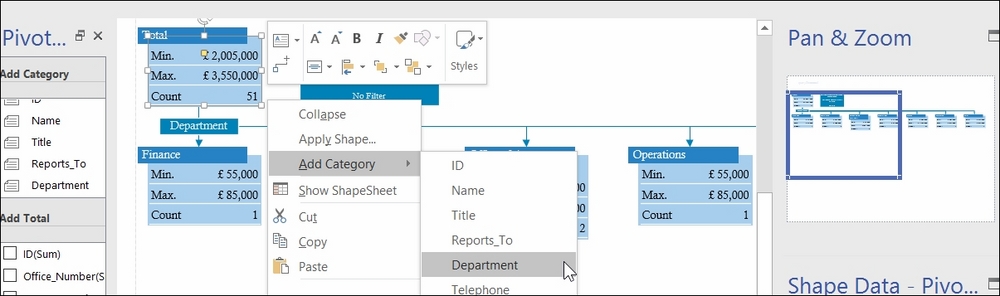
  • Learning how to use the Pivot Diagram add-on

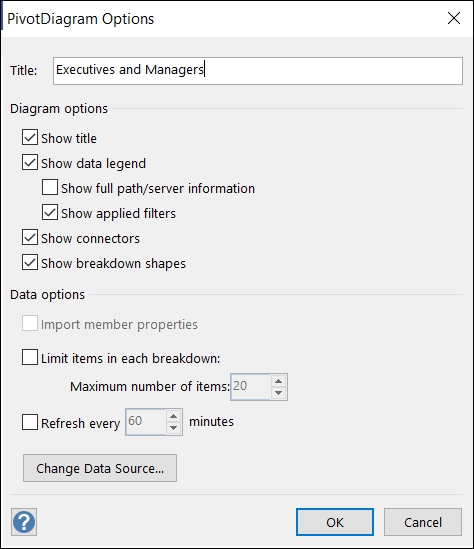
  • Configuring the diagrams

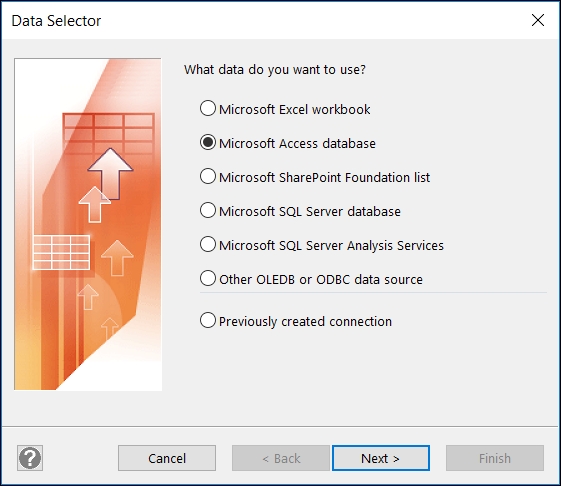
  • Understanding how to overlay data using Link Data

Choosing a data source


A Pivot Diagram can be started from the Business | PivotDiagram template or from the Insert PivotDiagram ribbon button, which can be added using the Customize the Ribbon… tool. The Data Selector dialog that is presented is almost identical to the one opened by Data | Custom Import, except for the additional Microsoft SQL Server Analysis Services option, as seen in the following screenshot:

The queryPersonnel query from the Microsoft Access database, OrgData.accdb, that was used in Chapter 3, Linking Data to Shapes, has been used for the following example. The next screenshot demonstrates how any numerical and date columns are automatically presented as options in the Add Total box in the PivotDiagram window:

Ticking and unticking columns in the Add Total box will cause the Data Graphics on the Total shape to change. This shape is actually an instance of a master called Pivot Node, which is present in the document stencil.

The add-on has its own ribbon tab labeled PIVOT...

Configuring the default Data Graphics


The Pivot Node shapes just use the normal Data Graphics features that were described in Chapter 4, Using the Built-In Data Graphics, so they can be configured in just the same way, as shown in the following screenshot:

Breaking down by category


Of course, it would be pretty pointless to just show a single shape on the page, and the Pivot Diagram add-on provides the ability to break down by a selected category from either the Add Category box on the Pivot Diagram window, or from the right-click menu option, Add Category, on a Pivot Node shape, as shown in the next screenshot:

By default, a Pivot Breakdown shape labeled Department (in the screenshot) is added between the initial Pivot Node shape and the new Pivot Node shapes. These Breakdown Shapes can be hidden with the option on the Show\Hide group, but they also have a right-click menu option that can be useful.

The first option in this menu, Collapse, will remove the Breakdown Shape, the child Pivot Connector shapes, and the child Pivot Node shapes.

Sorting Pivot Nodes

The second option, Sort…, on the right-click menu of the Breakdown Shapes, opens the Breakdown Options dialog. This can be used to sort the child nodes by a Shape Data row that is available...

Applying shapes to enhance legibility


There are times when it is useful to add a graphic to Pivot Node shapes, so as to better represent their meaning. The PIVOT DIAGRAM | Format | Apply Shape button opens the Apply Shape dialog. This dialog, as shown next, presents the open stencils (apart from the PivotDiagram Shapes one) to be selected with the Stencil drop-down list. The masters on the selected stencil are displayed:

When a master is selected and the OK button is pressed, the shape is inserted into the selected Pivot Node shapes.

Configuring the PivotDiagram options


There are a few options that can be configured for the whole diagram using the PivotDiagram Options dialog, as shown in the next screenshot. This can be opened from the PIVOT DIAGRAM | Data | Data Options button:

This dialog contains some options that were already in the Show/Hide group, but it contains more items that can have their visibility toggled with, such as the Pivot Connector shapes.

It also allows a refresh period to be set to fire every time between 1 and 60 minutes. The data sources can be refreshed manually using the Data | Refresh button, or it can fire periodically using this dialog.

Unlike the Link Data feature described in Chapter 3, Linking Data to Shapes, the data source of PivotDiagrams cannot be configured in SharePoint to automatically refresh periodically without being open in the Visio client.

Laying the nodes out


There are some useful buttons available in the PIVOT DIAGRAM | Layout ribbon group. The actions apply to the immediate child nodes of the selected Pivot Node shape or shapes. So, in the next screenshot, the child nodes are shown with the Alignment | Left option, but they are about to be changed to Alignment | Top. This will cause them to rearrange vertically:

The direction of all the child nodes of a selected Pivot Node shape can also be changed, as shown in the next screenshot where the whole diagram was changed from Top-to-Bottom to Left-to-Right:

Overlaying linked data


The data source for the Pivot Diagram structure may not be refreshable in SharePoint, but there is nothing to prevent some of the displayed data from being refreshable by using the Link Data feature. In the following example, the same queryPersonnel query that was used to generate the Pivot Diagram has been imported using the Data | External Data | Custom Import button. The values in the Name Data Column field are matched with the values in the Shape Field Member:

This will add the data from the matching rows to the Pivot Node shapes. These can then have a new Data Graphic applied to them, as shown in the following screenshot:

So, the Pivot Diagram add-on can be used to create the framework for a refreshable dashboard in addition to providing roll-up and aggregation of data.

Since the Pivot Breakdown and Pivot Connector shapes do not need to be displayed, the diagram does not need to look hierarchical either. The Pivot Node shapes can be arranged to suit, for example...

Summary


In this chapter, we learned about the Pivot Diagram add-on, and how it uses some of the same technology as the Custom Import feature. We have seen how to configure the options of a diagram, and how to overlay data using Custom Import.

In the next chapter, we will learn about creating custom masters for use with Link Data. This will increase the reusability and efficiency, and it will reduce the maintenance required.

lock icon The rest of the chapter is locked
You have been reading a chapter from
Mastering Data Visualization with Microsoft Visio Professional 2016
Published in: May 2016 Publisher: Packt ISBN-13: 9781785882661
Register for a free Packt account to unlock a world of extra content!
A free Packt account unlocks extra newsletters, articles, discounted offers, and much more. Start advancing your knowledge today.
Unlock this book and the full library FREE for 7 days
Get unlimited access to 7000+ expert-authored eBooks and videos courses covering every tech area you can think of
Renews at €14.99/month. Cancel anytime}