


Understanding the Power BI layers
As stated before, Power BI is not just a reporting tool. As this book focuses on data modeling, we will not spend much time explaining the tool itself; instead, we cover some concepts that should be pointed out. When we talk about data modeling in Power BI, we refer to Power BI Desktop as a development tool. You can think of Power BI Desktop like Visual Studio when developing an SQL Server Analysis Services (SSAS) Tabular model. Power BI Desktop is a free tool offered by Microsoft that can be downloaded from https://powerbi.microsoft.com/en-us/downloads/.
This book refers to Power BI Desktop when mentioning Power BI unless stated otherwise.
The following illustration shows a straightforward process we usually go through while building a report in Power BI Desktop:
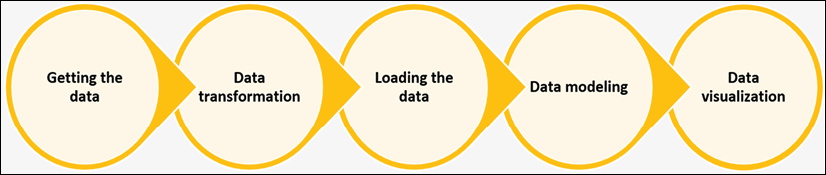
Figure 1.1: Building a new report process in Power BI
We use different conceptual layers of Power BI to go through the preceding processes. The following image shows where to access these layers in Power BI Desktop:
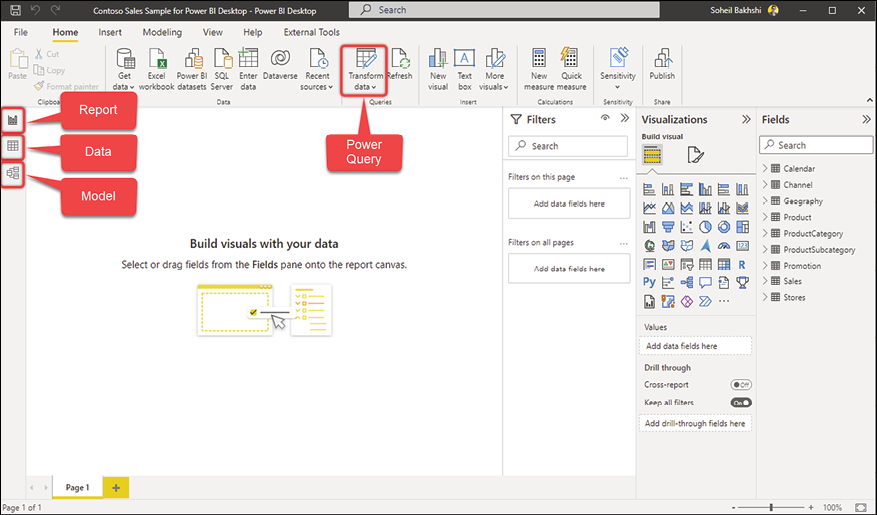
Figure 1.2: Power BI layers
Let us discuss each point in detail:
- The Power Query (data preparation) layer
- The Model layer (data model)
- The Report layer (data visualization)
The Data tab shown in the preceding image is where we can see the actual data loaded into the data model, so it is not considered a layer in Power BI Desktop.
To follow the following exercises, download the Microsoft Contoso Sales sample for Power BI Desktop from https://www.microsoft.com/en-us/download/confirmation.aspx?id=46801.
The data preparation layer (Power Query)
In this layer, we get the data from various data sources, transform and cleanse that data, and make it available for the next layer. This is the first layer that touches the data, so it is an essential part of the data journey in Power BI. In the Power Query layer, we decide which queries load data into the data model and which ones take care of data transformation and data cleansing without loading the data into the data model:
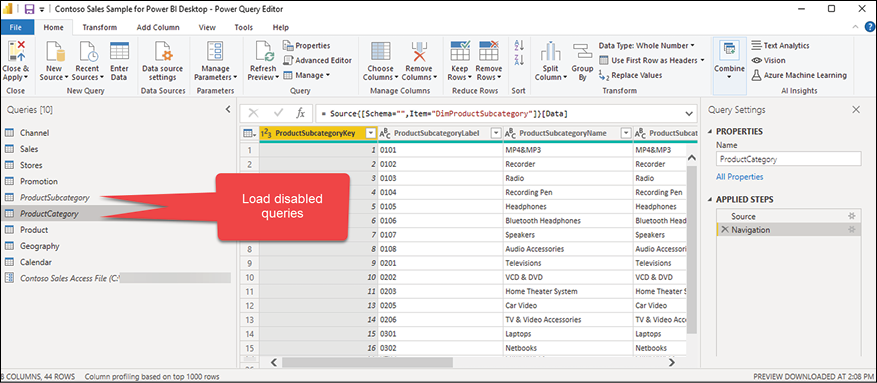
Figure 1.3: Power Query
The data model layer
This layer has two views, the Data view and the Model view. In the Data view, we see the data being loaded; in the Model view, we see the data model, including the tables and their relationships.
The Data view
After finishing the data preparation in the Power Query layer, we load the data into the data model layer. We can see the underlying data in our data model using the Data view. Depending on the connection mode, the Data view may or may not show the underlying data. We can take actions such as creating calculated tables, calculated columns, and measures or copying data from tables within the Data view.
All objects we create using DAX (measures, calculated columns, and so on) are a part of our data model.
The following screenshot shows the Data view in Power BI Desktop when the storage mode of the Sales table is Import:
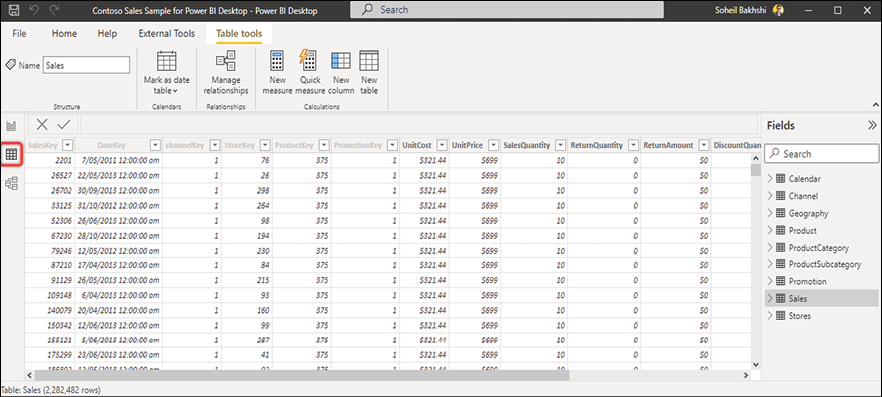
Figure 1.4: Data view; storage mode: Import
If the table’s storage mode is DirectQuery, then the Data view does not show the underlying data, as the following image illustrates:
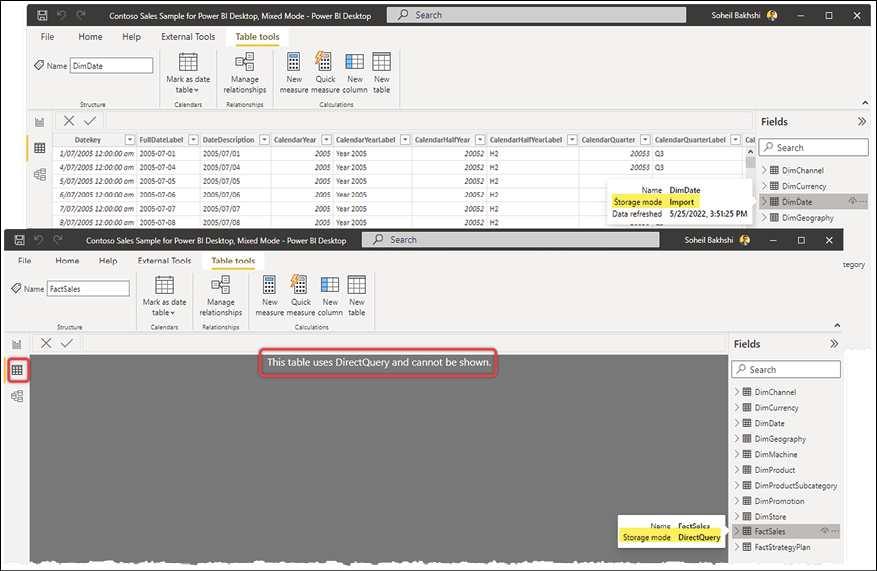
Figure 1.5: Data view; storage mode: DirectQuery
The Model view
As its name implies, the Model view is where we stitch all the pieces together. We can see the current relationships between the tables, create new relationships, format fields, define synonyms, and show and hide fields in the Model view. The following image shows the Model view of the Contoso Sales Sample when we selected the Store table:
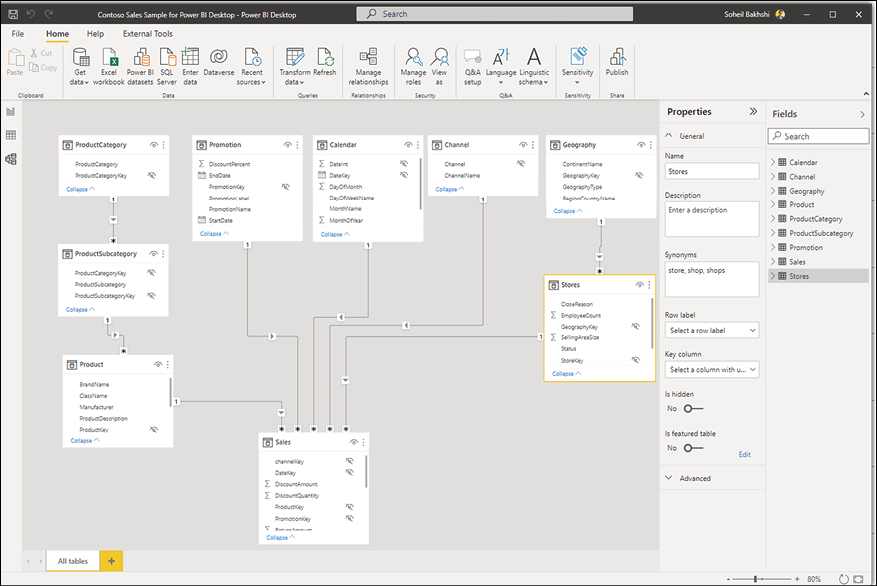
Figure 1.6: Model view
The data visualization layer
In this layer, we bring the data to life by making meaningful and professional-looking data visualizations. The data visualization layer is accessible via the Report view, the default view in Power BI Desktop.
The Report view
In the Report view, we can build storytelling visualizations to help businesses make data-driven decisions. We can also create analytical calculations with DAX, such as calculated tables, calculated columns, and measures from the Fields pane in the Report view, but this does not mean those objects are a part of the data visualization layer. Indeed, they are a part of the data model layer.
The following image shows the Report view of the Sales & Returns Sample:
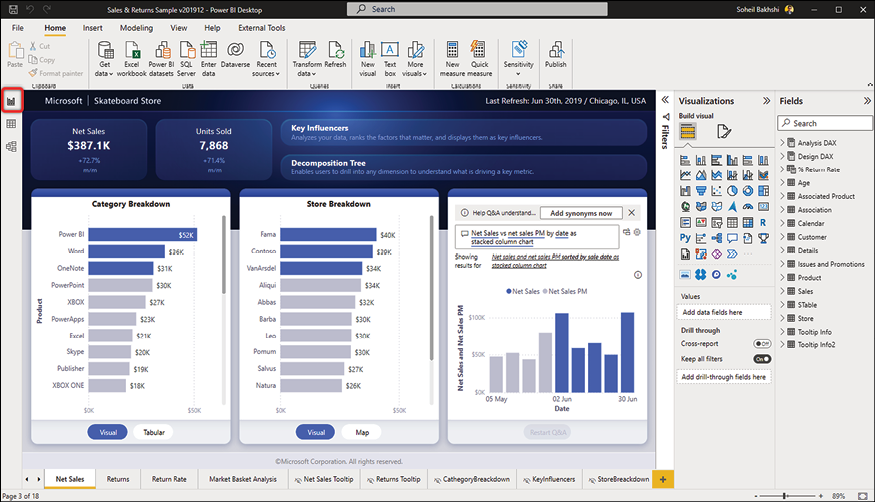
Figure 1.7: The Report view
To load the preceding view, download the Sales & Returns sample.pbix file from https://docs.microsoft.com/en-us/power-bi/create-reports/sample-datasets#sales--returns-sample-pbix-file.
How data flows in Power BI
Understanding how data flows during its journey in Power BI is vital. For instance, when we face an issue with some calculations in a report, we know how to analyze the root cause and trace the issue back to an actionable point. When we find an incorrect value in a line chart, and the line chart uses a measure dependent on a calculated column, we know that we do not find that calculated column in Power Query. The reason is that the objects we create in the data model are not accessible in Power Query. So, in that sense, we never look for a measure in the Power Query layer. We also do not expect to use custom functions created within Power Query in the data model layer. We discuss custom functions in the Custom Functions section of Chapter 3, Data Preparation in Power Query Editor.
The following image shows the flow of data between different layers in Power BI:
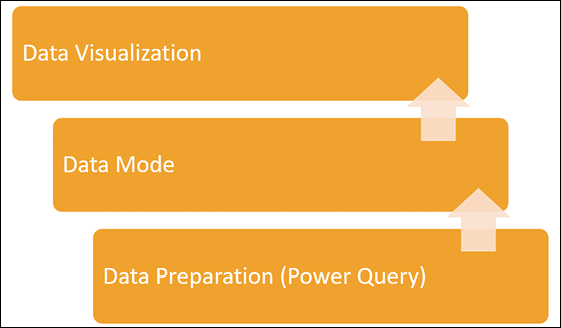
Figure 1.8: The flow of data in Power BI
To understand the flow of data better, let us go through a scenario.
In a Power BI report, the developer has defined a query parameter. The parameter has a list of capital letters, E, O, and P. There is also a Product query in Power Query holding descriptive information about the product. The parameter filters the Product Name column. Therefore, when the developer selects E from the parameter, the Product query filters the results showing only the products whose name starts with E. The connection mode is Import.
We put a Table visual on the report canvas with the Product Name column. Can we add a Slicer visual to the report canvas showing the parameter’s values, so the end user changes the values in the Slicer and sees the changes in the Table visual?
To answer the question, we need to think about Power BI layers. Let us do some analysis:
- The query parameters are defined in the data preparation layer in Power Query.
- Filtering a query is also a transformation step in Power Query, which changes the result sets of the query. Therefore, when we import the data into the data model, the result sets do not change unless we change the parameter’s values, which changes the result sets of the Product query and imports the new result sets to the data model.
- By default, query parameter’s values are not loaded into the data model unless the developer sets Enable load. Setting Enable load only loads the selected values from the parameters list and not the whole list.
- We refer to the data visualization layer when we talk about a Slicer visual. This means that the Slicer can only access the data loaded into the data model.
So, the answer is no. After importing the curated data into the data model, it is accessible to the data visualization layer.
Now that we understand the flow of data in Power BI, it is time to learn more about data modeling in Power BI.