


 Download code from GitHub
The development of open source GIS technologies has reached a state where they can seamlessly replace proprietary software in the recent years. They are convenient, capable tools for analyzing geospatial data. They offer solutions from basic analysis to more advanced, even scientific, workflows. Moreover, there are tons of open geographical data out there, and some of them can even be used for commercial purposes. In this chapter, we will acquaint ourselves with the open source software used in this book, install and configure them with an emphasis on typical pitfalls, and learn about some of the most popular sources of open data out there.
In this chapter, we will cover the following topics:
- Installing the required software
- Configuring the software
- Free geographical data sources
- Software and data licenses
Before jumping into the installation process, let's discuss geographic information systems (GIS) a little bit. GIS is a system for collecting, manipulating, managing, visualizing, analyzing, and publishing spatial data. Although these functionalities can be bundled in a single software, by definition, GIS is not a software, it is rather a set of functionalities. It can help you to make better decisions, and to get more in-depth results from data based on their spatial relationships.
The most important part of the former definition is spatial data. GIS handles data based on their locations in a coordinate reference system. This means, despite GIS mainly being used for handling and processing geographical data (data that can be mapped to the surface of Earth), it can be used for anything with dimensions. For example, a fictional land like Middle-Earth, the Milky Way, the surface of Mars, the human body, or a single atom. The possibilities are endless; however, for most of them, there are specialized tools that are more feasible to use.
The functionalities of a GIS outline the required capabilities of a GIS expert. Experts need to be able to collect data either by surveying, accessing an other's measurements, or digitizing paper maps, just to mention a few methods. Collecting data is only the first step. Experts need to know how to manage this data. This functionality assumes knowledge not only in spatial data formats but also in database management. Some of the data just cannot fit into a single file. There can be various reasons behind this; for example, the data size or the need for more sophisticated reading and writing operations. Experts also need to visualize, manipulate, and analyze this data. This is the part where GIS clients come in, as they have the capabilities to render, edit, and process datasets. Finally, experts need to be able to create visualizations from the results in order to show them, verify decisions, or just help people interpreting spatial patterns. This phase was traditionally done via paper maps and digital maps, but nowadays, web mapping is also a very popular means of publishing data.
From these capabilities, we will learn how to access data from freely available data sources, store and manage them in a database, visualize and analyze them with a GIS client, and publish them on the Web.
Most of the software used in this book is platform-dependent; therefore, they have different ways of getting installed on different operating systems. I assume you have enough experience with your current OS to install software, and thus, we will focus on the possible product-related pitfalls in a given OS. We will cover the three most popular operating systems--Linux, Windows, and macOS. If you don't need the database or the web stack, you can skip the installation of the related software and jump through the examples using them.
Note
Make sure you read the OS-related instructions before installing the software if you do not have enough experience with them.
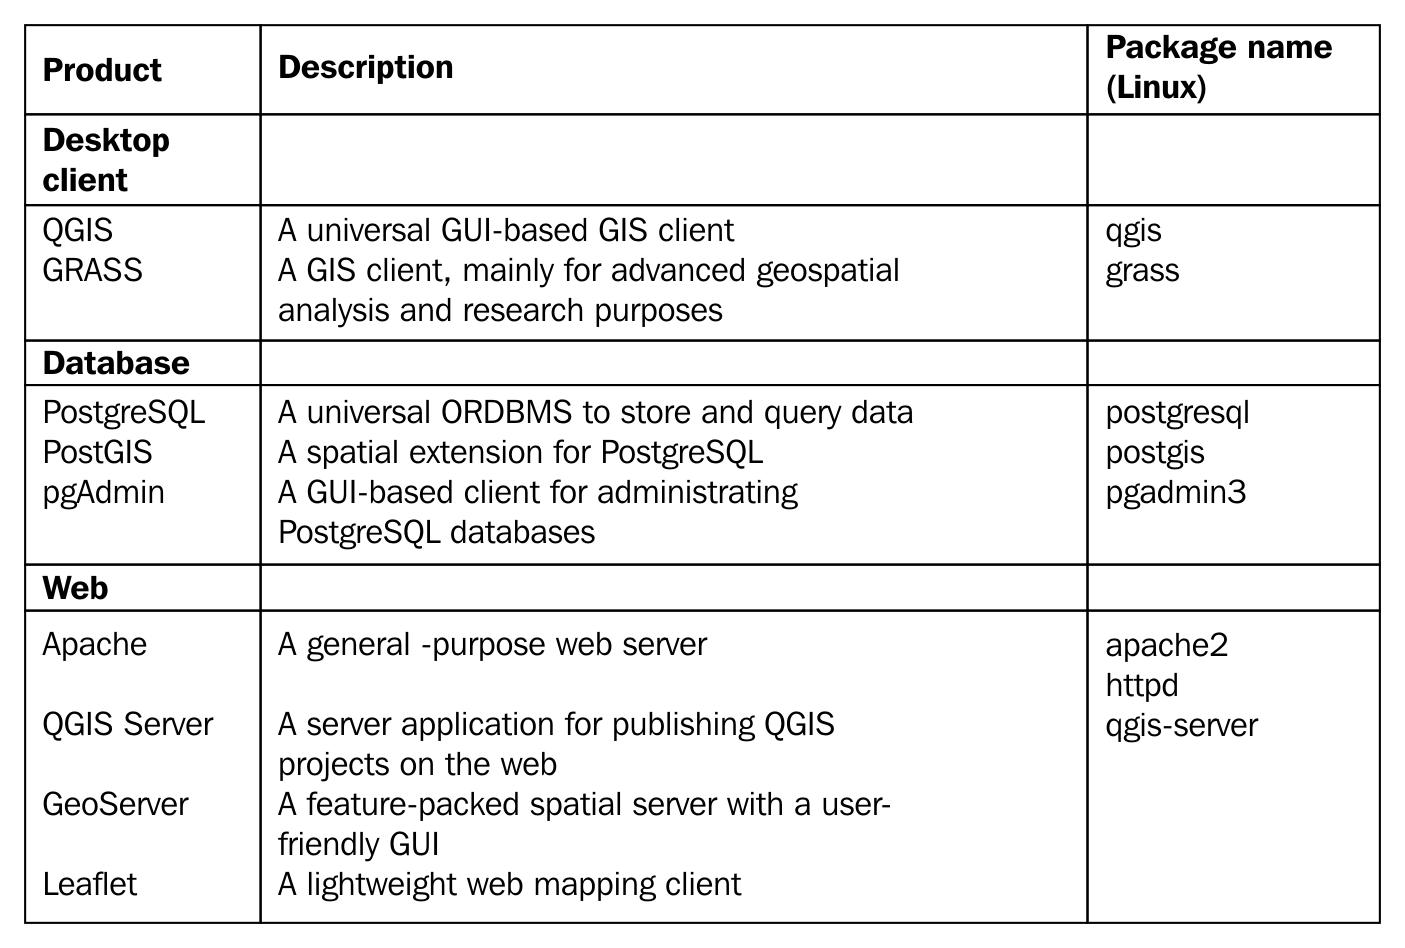
The list of the software stack used in this book can be found in the following thematically grouped table:
Note
Some of these packages are changeable; you can try them out if you have enough experience or have some time for tinkering. For example, you can use nginx instead of Apache, or you can use the WAR (Web Archive) version of GeoServer with your Java servlet instead of the platform independent binary. You can also use pgAdmin 4 and any subversion of GRASS 6 or GRASS 7 (or even both of them).
Installing the packages on Linux distributions is pretty straightforward. The dependencies are installed with the packages, when there are any. We only have to watch out for three things prior to installing the packages. First of all, the package name of the Apache web server can vary between different distributions. On distros using RPM packages (for example--Fedora, CentOS, and openSUSE), it is called httpd, while on the ones using DEB packages (for example--Debian and Ubuntu), it is called apache2. On Arch Linux, it is simply called apache.
Note
While Arch Linux is far from the best distribution for using GIS, you can get most of the packages from AUR (Arch User Repository).
The second consideration is related to distributions which do not update their packages frequently, like Debian. GeoServer has a hard dependency of a specific JRE (Java Runtime Environment). We must make sure we have it installed and configured as the default. We will walk through the Debian JRE installation process as it is the most popular Linux distribution with late official package updates. Debian Jessie, the latest stable release of the OS when writing these lines, is packed with OpenJDK 7, while GeoServer 2.11 requires JRE 8:
Note
You can check the JRE version of the latest GeoServer version uses at http://docs.geoserver.org/latest/en/user/installation/index.html. You can check the JRE version installed on your OS with the terminal command update-alternatives --list java.
- To install OpenJDK 8, we have to enable the Backports repository according to the official Debian guide at https://wiki.debian.org/Backports.
- If the repository is added, we can reload the packages and install the package
openjdk-8-jre. - The next step is to make this JRE the default one. We can do this by opening a terminal and typing the following command:
update-alternatives --config java- The next step is self-explanatory; we have to choose the new default environment by typing its ID and pressing enter.
Note
Make sure to disable the Backports repository by commenting it out in /etc/apt/sources.list, or by checking out its checkbox in Synaptic after installing the required packages. It can boycott further updates in some cases.
The last consideration before installing the packages is related to the actual version of QGIS. Most of the distributions offer the latest version in a decent time after release; however, some of them like Debian do not. For those distros, we can use QGIS's repository following the official guide at http://www.qgis.org/en/site/forusers/alldownloads.html.
After all things are set, we can proceed and install the required packages. The order should not matter. If done, let's take a look at GeoServer, which doesn't offer Linux packages to install. It offers two methods for Linux: a WAR for already installed Java servlets (such as Apache Tomcat), and a self-containing platform independent binary. We will use the latter as it's easier to set up:
- Download GeoServer's platform independent binary from http://geoserver.org/release/stable/.
Note
If there is absolutely no way to install OpenJDK 8 on your computer, you can use GeoServer 2.8, which depends on JRE 7. You can download it from http://geoserver.org/release/2.8.5/.
- Extract the downloaded archive. It can be anywhere as long as we have a write permission to the destination.
- Start GeoServer with its startup script. To do this, we navigate into the extracted archive from a terminal and run
startup.shin itsbinfolder with the following command:
      cd <geoserver's folder>/bin
./startup.sh- Optionally, we can detach GeoServer from the shell used by the terminal with the startup command
nohup ./startup.sh > /dev/null &. This way, we can close the terminal. If we would like to shut down GeoServer manually, we can do so by running itsshutdown.shscript.
Note
By default, the shell closes every subprocess it started before terminating itself. By using nohup, we override this behavior for the GeoServer process, and by using & at the end of the command, we fork the process. This way, we regain control over the shell. The >/dev/null part prevents nohup from logging GeoServer's verbose startup messages.
Installing the required software on Windows only requires a few installers as most of the packages are bundled into the OSGeo4W installer.
- First of all, we have to download the 32-bit installer from https://trac.osgeo.org/osgeo4w/ as this is the only architecture where an OSGeo version of Apache is bundled.
- Opening the installer, we can choose between different setups. For our cause, we should choose
Advanced Install. When we reach theSelect Packagessection, we must choose the following packages as a minimum:
- Desktop--
grass,qgis - Web--
apache,qgis-server
- The next page tells us we don't have to bother with dependencies as the installer selected them for us automatically.
- The last step can be quite troublesome as there isn't a general solution; we have to configure Apache and QGIS Server if they don't want to collaborate (opening
http://localhost/qgis/qgis_mapserv.fcgi.exereturns anInternal Server Erroror it simply cannot be reached). For a good start, take a look at the official tutorial at http://hub.qgis.org/projects/quantum-gis/wiki/QGIS_Server_Tutorial.
Don't worry if you end up with no solutions, we will concentrate on GeoServer, which runs perfectly on Windows. Just make sure Apache is installed and working (i.e. http://localhost returns a blank page or the OSGeo4W default page), as we will need it later.
Note
If you would like to install the 64-bit version of Apache separately, you can find suggestions on compiled 64-bit binaries at https://httpd.apache.org/docs/current/platform/windows.html.
- The next thing to consider is the PostgreSQL stack. We can download the installer from https://www.postgresql.org/download/windows/, where the EnterpriseDB edition comes with a very handy Stack Builder. After the installation of PostgreSQL, we can use it to install PostGIS. We can find PostGIS in the
Spatial Extensionsmenu. The default installer comes with pgAdmin 4, while we will use pgAdmin 3 in this book. The two look and feel similar enough; however, if you would like to install the latter, you can download it from https://www.pgadmin.org/download/pgadmin-3-windows/.
Note
The last thing to install is GeoServer, which is such an easy task that we won't discuss it. You can download the installer from http://geoserver.org/release/stable/. Make sure you have Java 8 (https://java.com/en/download/) before starting it!
Installing the software on macOS could be the most complicated of all (because of GRASS). However, thanks to William Kyngesburye, the compiled version of QGIS already contains a copy of GRASS along with other GIS software used by QGIS. In order to install QGIS, we have to download the disk image from http://www.kyngchaos.com/software/qgis.
Note
If you need the GIS software on OS X 10.6 or older, take a look at Kyngesburye's archive at http://www.kyngchaos.com/software/archive. Before installing the software, make sure you read his hints and warnings related to the given image.
PostgreSQL and PostGIS are also available from the same site, you will see the link on the left sidebar. pgAdmin, on the other hand, is available from another source: https://www.pgadmin.org/download/pgadmin-4-macos/. Finally, the GeoServer macOS image can be downloaded from http://geoserver.org/release/stable/, while its dependency of Java 8 can be downloaded from https://www.java.com/en/download/.
Note
If you would like to use pgAdmin 3 instead, or pgAdmin 4 is not supported by your OS, you can download pgAdmin 3 from https://www.pgadmin.org/download/pgadmin-3-macos/.
The only thing left is configuring the QGIS Server. As the OS X and macOS operating systems are shipped with an Apache web server, we don't have to install it. However, we have to make some configurations manually due to the lack of the FastCGI Apache module, on which QGIS Server relies. This configuration can be made based on the official guide at http://hub.qgis.org/projects/quantum-gis/wiki/QGIS_Server_Tutorial.
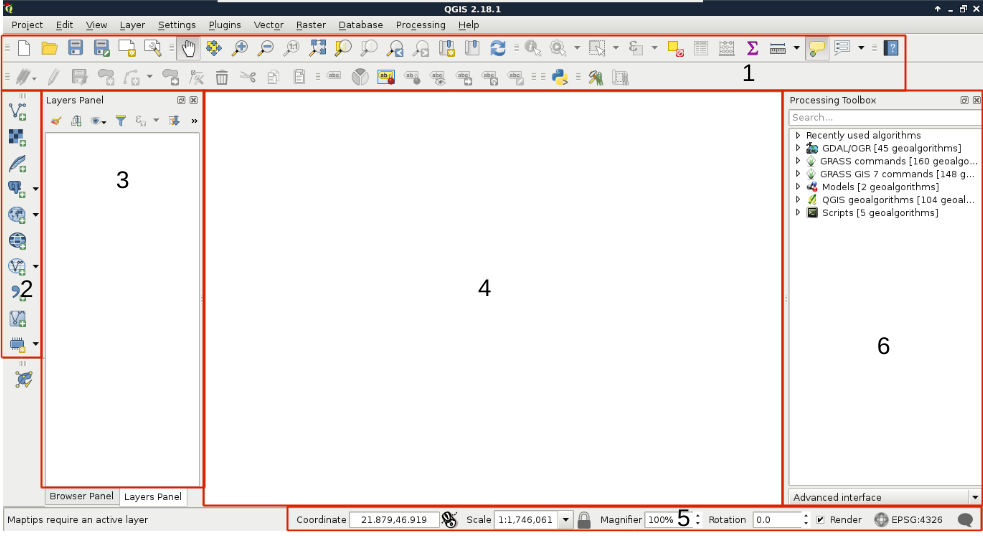
Congratulations! You're through the hardest part of this chapter. The following step is to make some initial configurations on the installed software to make them ready to use when we need them. First of all, let's open QGIS. At first glance, it has a lot of tools. However, most of them are very simple and self-explanatory. We can group the parts of the GUI as shown in the following image:
Note
You can learn more about the individual GUI tools from the online QGIS manual at http://docs.qgis.org/2.14/en/docs/user_manual/introduction/qgis_gui.html. It is somewhat outdated; however, the GUI hasn't changed much since then (and presumably, it won't change anymore until QGIS 3.0).
We can describe the distinct parts of the QGIS GUI as follows:
- Main toolbar: We can manage our current workflow, pan the map, and make selections and queries from here. Additionally, new tools from plugins will end up somewhere here.
- Add layer: From this handy toolbar, we can add a lot of different spatial data with only a few clicks.
- Layer tree: We can manage our layers from here. We can select them, style them individually, and even apply filters on most of them.
- Map canvas: This is the main panel of QGIS where the visible layers will be drawn. We can pan and zoom our maps with our mouse from here.
- Status bar: These are the simple, yet powerful tools for customizing our view. We can zoom to specified scales, coordinates, and even rotate the map. We can also quickly change our projection, which we will discuss in more depth later.
- Processing toolbar: We can access most of the geoalgorithms bundled in QGIS, and even use other open source GIS clients when they are more fitting for the task.
The only thing we will do now without having any data to display, is customizing the GUI. Let's click on Settings and choose the Options menu. In the first tab called General, we can see some styles to choose from. Don't forget to restart QGIS every time you choose a new style.
Note
Did you know that like much professional software, QGIS also has a night mode? You can toggle it from the UI Theme option in the General tab without restarting the software.
The next piece of software we look at is PostGIS via pgAdmin. If we open pgAdmin, the least we will see is an empty Server Groups item on the left panel. If this is the case, we have to define a new connection with the plug icon and fill out the form (Object | Create | Server in pgAdmin 4), as follows:
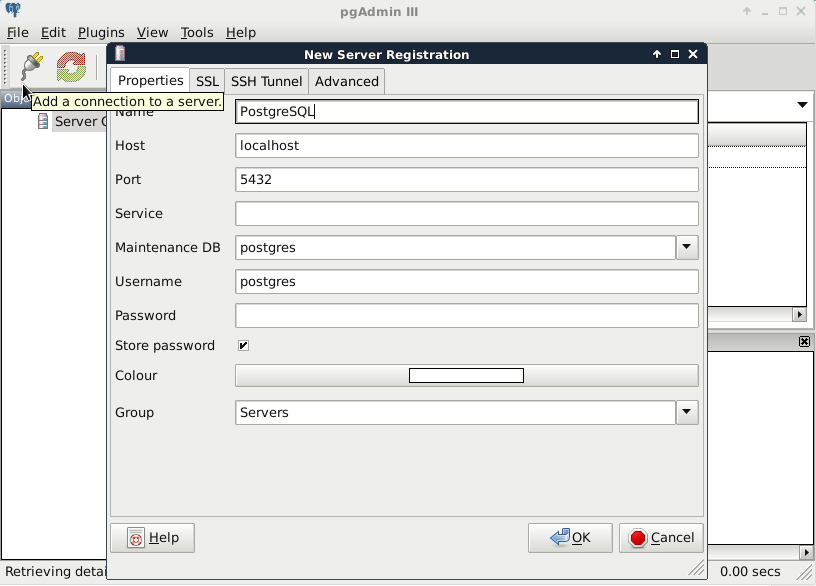
The Name can be anything we would like, it only acts as a named item in the list we can choose from. The Host, the Port, and the Username, on the other hand, have to be supplied properly. As we installed PostgreSQL locally, the host is 127.0.0.1, or simply localhost. As the default install comes with the default user postgres (we will refer to users as roles in the future due to the naming conventions of PostgreSQL), we should use that.
Note
On Windows, you can give a password for postgres at install time and you can also define the port number. If you changed the default port number or supplied a password, you have to fill out those fields correctly. On other platforms, there is no password by default; however, the database server can only be accessed from the local machine.
Upon connecting to the server, we can see a single database called postgres. This is the default database of the freshly installed PostgreSQL. As the next step, we create another database by right-clicking on Databases and selecting New Database. The database can be named as per our liking (I'm naming it spatial). The owner of the database should be the default postgres role in our case. The only other parameter we should define is the default character encoding of the database:
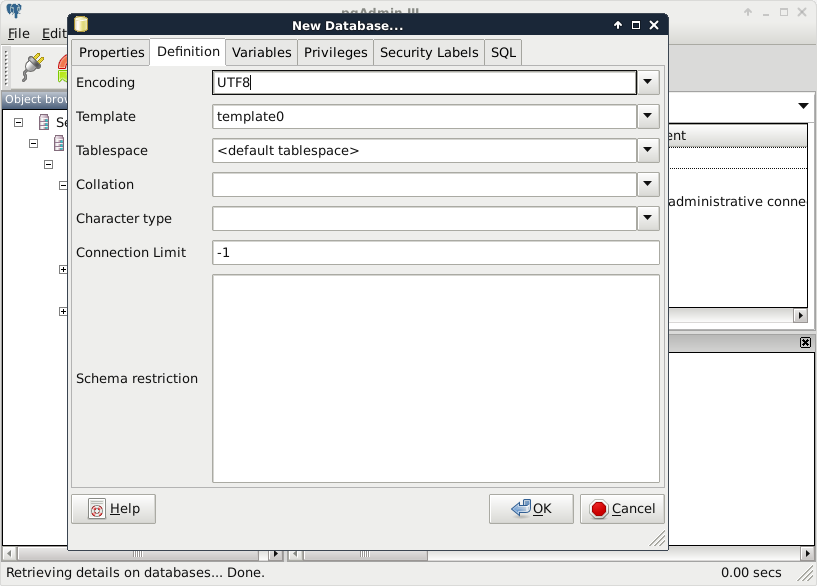
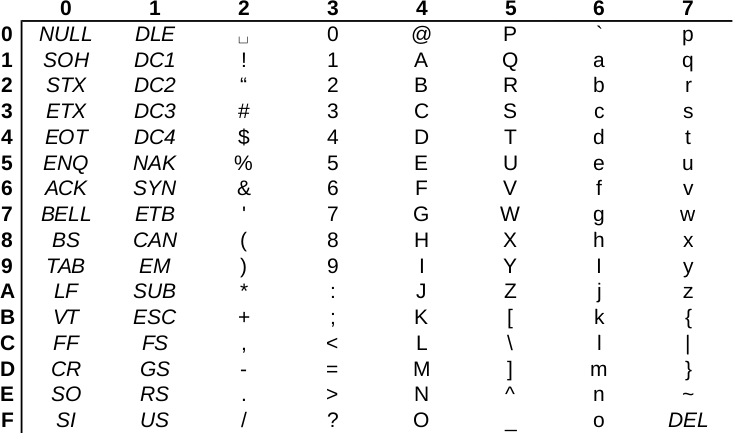
Choosing the template0 template is required as the default template's character encoding is a simple ASCII. You might be familiar with character encoding; however, refreshing our knowledge a little bit cannot hurt. In ASCII, every character is encoded on 8 bits, therefore, the number of characters which can be encoded is 28 = 256. Furthermore, in ASCII, only the first 7 bits (first 128 places) are reserved, the rest of them can be localized. The first 7 bits (in hexadecimal, 00-7F) can be visualized as in the following table. The italic values show control characters (https://en.wikipedia.org/wiki/C0_and_C1_control_codes#C0_.28ASCII_and_derivatives.29):
Open source GIS software offer a very high degree of freedom. Their license types can differ; however, they are all permissive licenses. That means we can use, distribute, modify, and distribute the modified versions of the software. We can also use them in commercial settings and even sell the software if we can find someone willing to buy it (as long as we sell the software with the source code under the same license). The only restriction is for companies who would like to sell their software under a proprietary license using open source components. They simply cannot do that with most of the software, although some of the licenses permit this kind of use, too.
There is one very important thing to watch out for when we use open source software and data. If somebody contributes often years of work to the community, at least proper attribution can be expected. Most of the open source licenses obligate this right of the copyright holder; however, we must distinguish software from data. Most of the licenses of open source software require the adapted product to reproduce the same license agreement. That is, we don't have to attribute the used software in a work, but we must include the original license with the copyright holders' name when we create an application with them. Data, on the other hand, is required to be attributed when we use it in our work.
There are a few licenses which do not obligate us to give proper attribution. These licenses state that the creator of the content waives every copyright and gives the product to the public to use without any restrictions. Two of the most common licenses of this kind are the Unlicense, which is a software license, and the Creative Commons Public Domain, which is in the GIS world mostly used as a data license.
Now that we have our software installed and configured, we can focus on collecting some open source data. Data collecting (or data capture) is one of the key expertise of a GIS professional and it often covers a major part of a project budget. Surveying is expensive (for example, equipment, amortization, staff, and so on); however, buying data can also be quite costly. On the other hand, there is open and free data out there, which can drastically reduce the cost of basic analysis. It has some drawbacks, though. For example, the licenses are much harder to attune with commercial activity, because some of them are more restrictive.
There are two types of data collection. The first one is primary data collection, where we measure spatial phenomena directly. We can measure the locations of different objects with GPS, the elevation with radar or lidar, the land cover with remote sensing. There are truly a lot of ways of data acquisition with different equipment. The second type is secondary data collection, where we convert already existing data for our use case. A typical secondary data collection method is digitizing objects from paper maps. In this section, we will acquire some open source primary data.
Note
If you do not feel like downloading anything from the following data sources, you can work with the sample dataset of this book. The sample covers Luxembourg, therefore you can download and visualize it in no time.
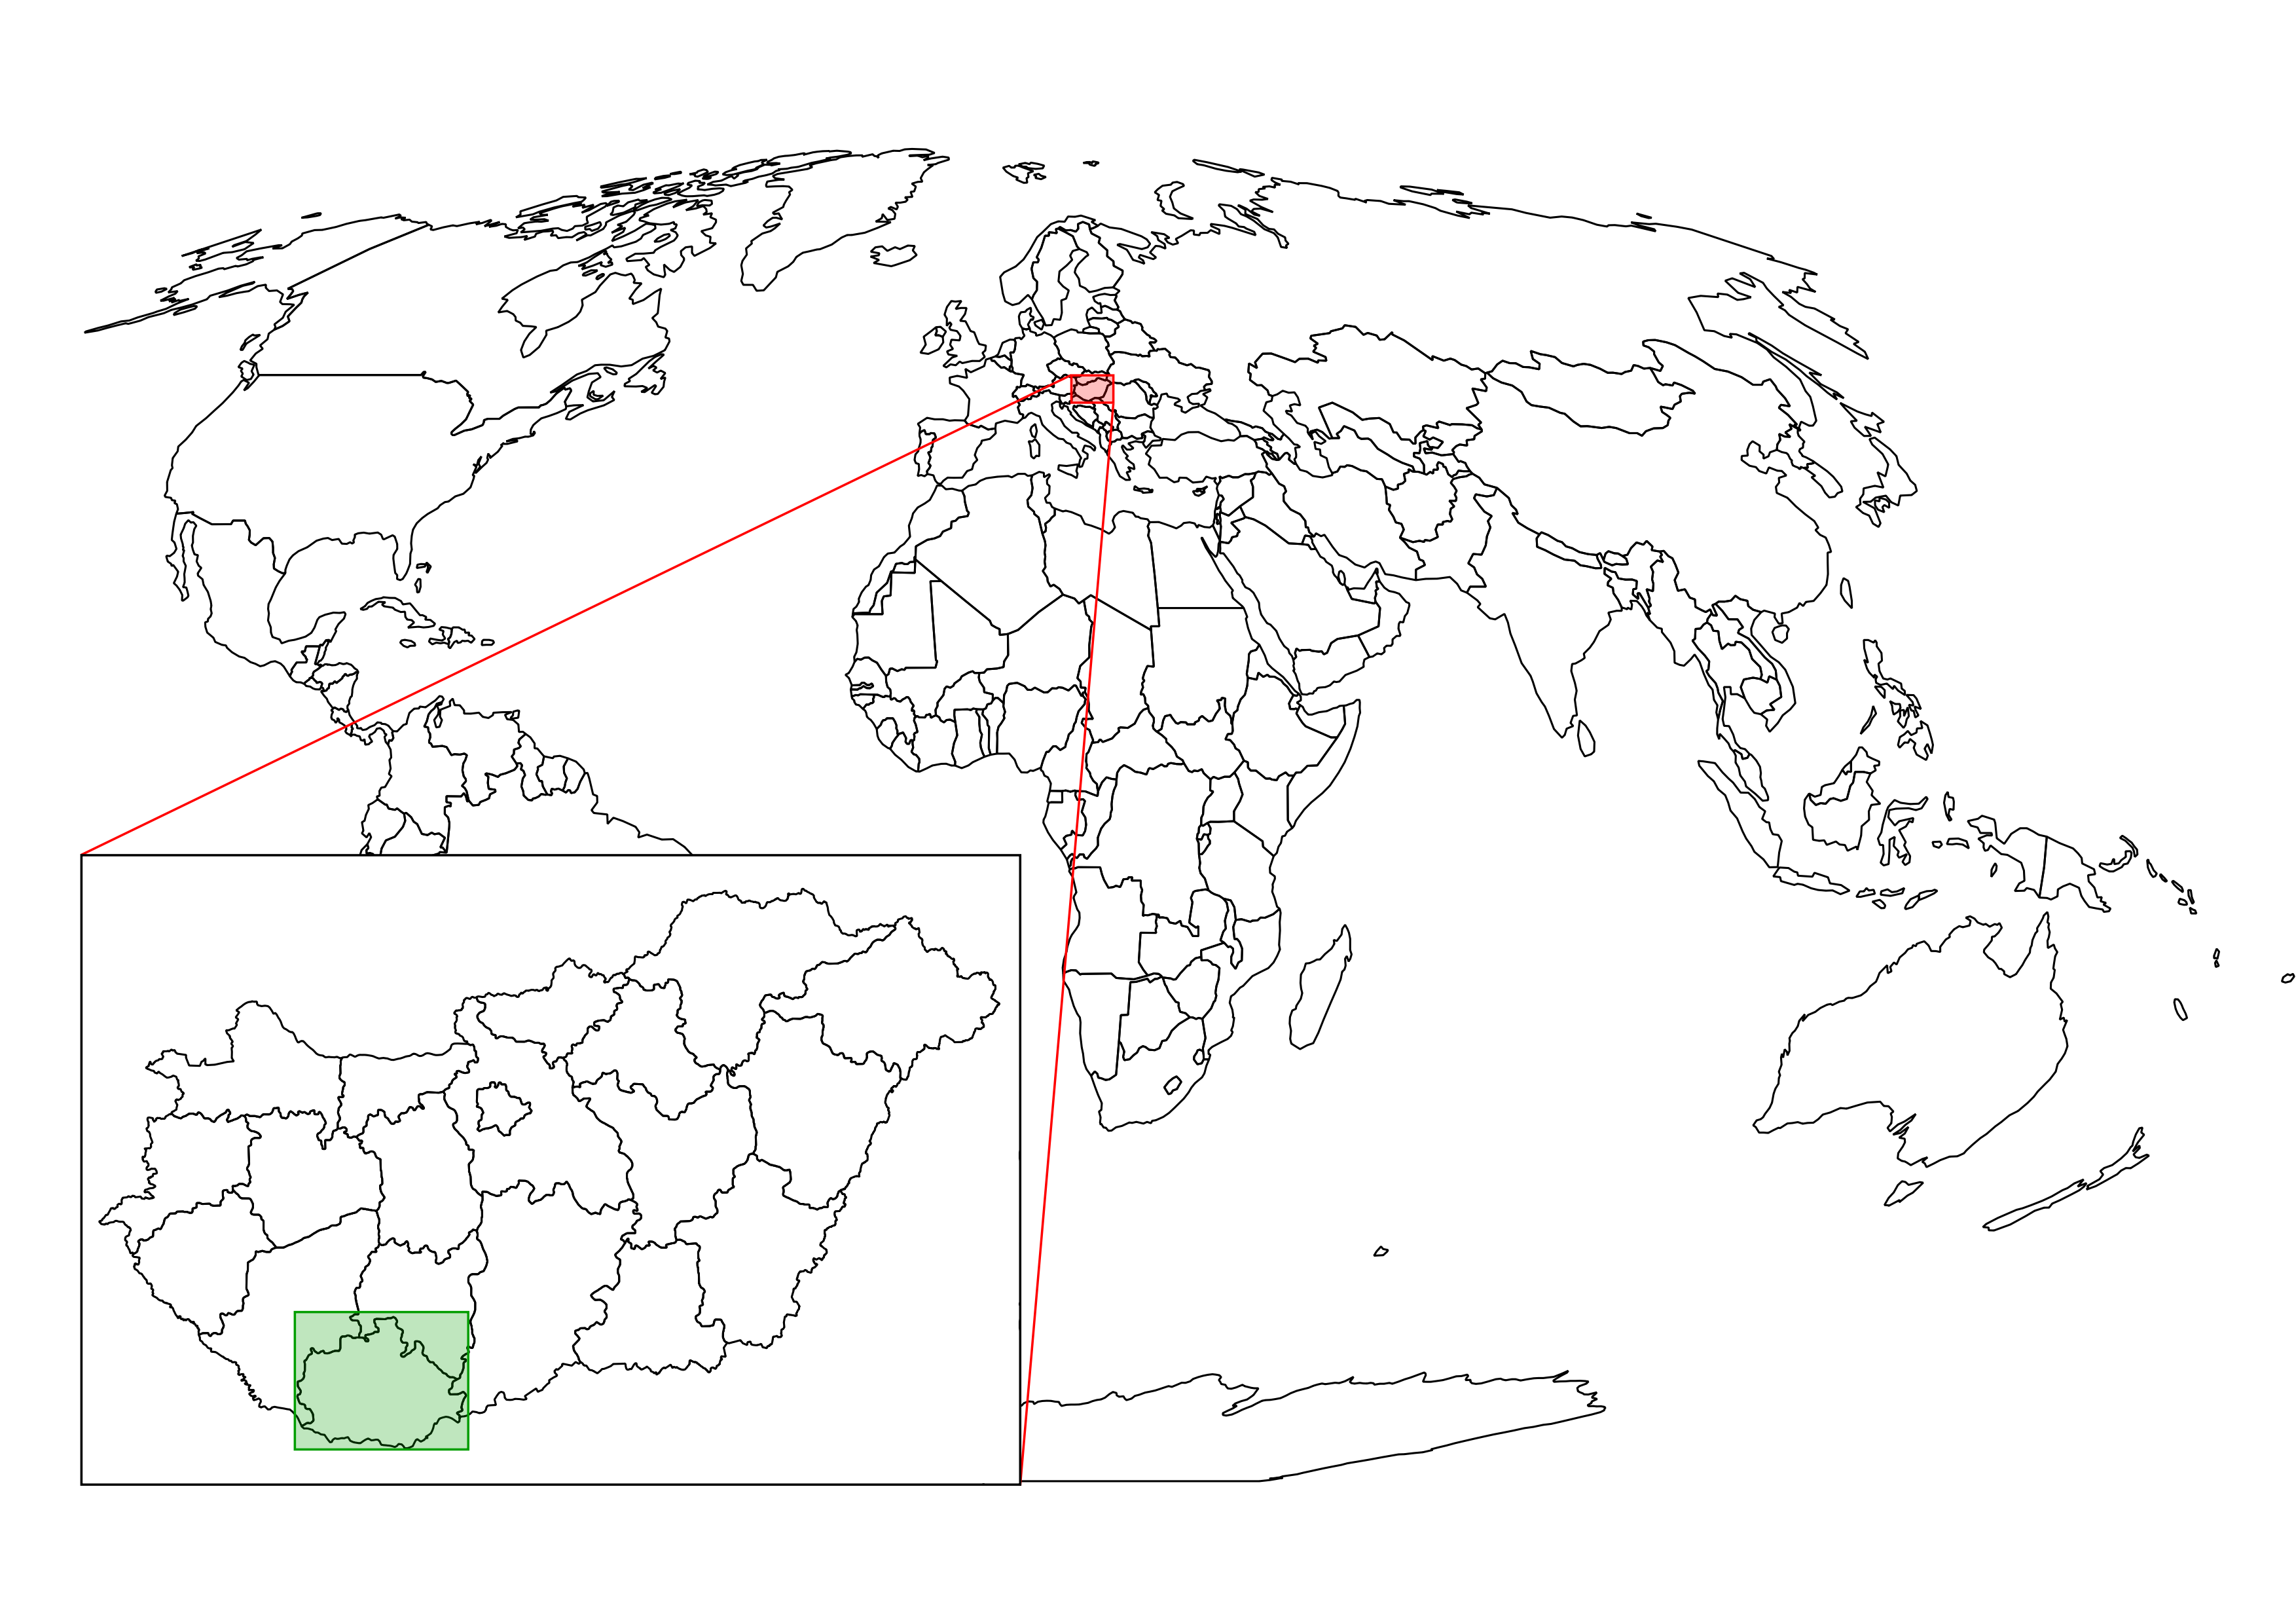
The only thing to consider is our study area. We should choose a relatively small administrative division, like a single county. For example, I'm choosing the county I live in as I'm quite familiar with it and it's small enough to make further analysis and visualization tasks fast and simple:
Note
Make sure you create a folder for the files that we will download. You should extract every dataset in a different folder with a talkative name to keep a clean working directory and to ease future work.
The first data we will download is the administrative boundaries of our country of choice. Open data for administrative divisions are easy to find for the first two levels, but it becomes more and more scarce for higher levels. The first level is always the countries' boundaries, while higher levels depend on the given country. There is a great source for acquiring the first three levels for every country in a fine resolution: GADM or Global Administrative Areas. We will talk about administration levels in more details in a later chapter. Let's download some data from http://www.gadm.org/country by selecting our study area, and the file format as Shapefile:
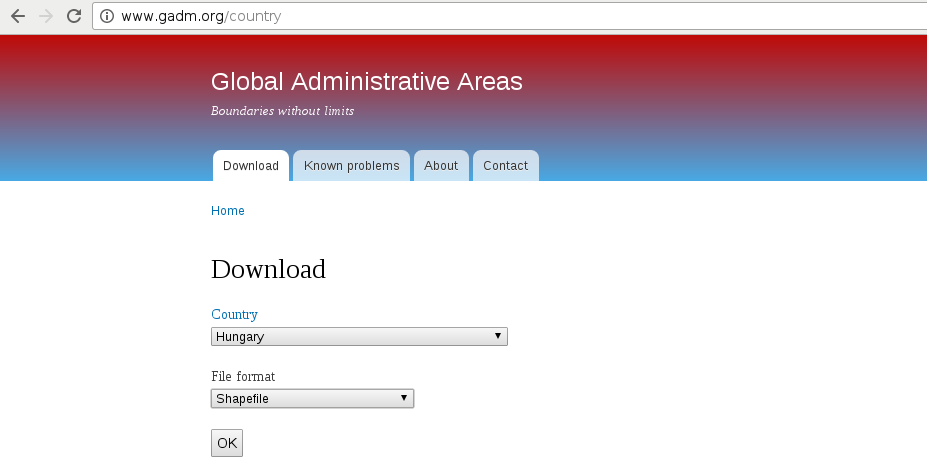
In the zipped archive, we will need the administrative boundaries, which contain our division of choice. If you aren't sure about the correct dataset, just extract everything and we will choose the correct one later.
The second vector dataset we download is the GeoNames archive for the country encasing our study area. GeoNames is a great place for finding data points. Every record in the database is a single point with a pair of coordinates and a lot of attribute data. Its most instinctive use case is for geocoding (linking names to locations). However, it can be a real treasure box for those who can link the rich attribute data to more meaningful objects. The country-level data dumps can be reached at http://download.geonames.org/export/dump/ through the countries' two-letter ISO codes.
Note
ISO (International Organization of Standards) is a large-scale organization maintaining a lot of standards for a wide variety of use cases. Country names also have ISO abbreviations, which can be reached at http://www.geonames.org/countries/ in the form of a list. The first column contains the two-letter ISO codes of the countries.
GADM's license is very restrictive. We are free to use the downloaded data for personal and research purposes but we cannot redistribute it or use it in commercial settings. Technically, it isn't open source data as it does not give the four freedoms of using, modifying, redistributing the original version, and redistributing the modified version without restrictions. That's why the example dataset doesn't contain GADM's version of Luxembourg.
Note
There is another data source, called Natural Earth, which is truly open source but it offers data only for the first two levels and on a lower resolution. If you need some boundaries with the least effort, make sure you check it out at http://www.naturalearthdata.com/downloads/.
GeoNames has two datasets--a commercially licensed premium dataset and an open source one. The open source data can be used for commercial purposes without restrictions.
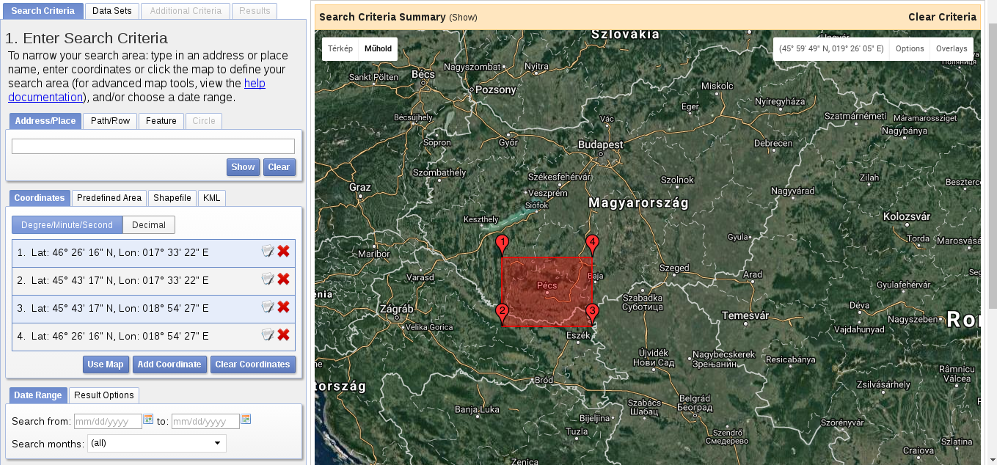
Data acquisition with instruments mounted on airborne vehicles is commonly called remote sensing. Mounting sensors on satellites is a common practice by space agencies (for example, NASA and ESA), and other resourceful companies. These are also the main source of open source data as both NASA and ESA grant free access to preprocessed data coming from these sensors. In this part of the book, we will download remote sensing data (often called imagery) from USGS's portal: Earth Explorer. It can be found at https://earthexplorer.usgs.gov/. As the first step, we have to register an account in order to download data.
Note
If you would like to download Sentinel-2 data instead of Landsat imagery, you can find ESA's Copernicus data portal at https://scihub.copernicus.eu/.
When we have an account, we should proceed to the Earth Explorer application and select our study area. We can select an area on the map by holding down the Shift button and drawing a rectangle with the mouse, as shown in the following screenshot:
As the next step, we should select some data from the Data Sets tab. There are two distinct types of remote sensing based on the type of sensor: active and passive. In active remote sensing, we emit some kind of signal from the instrument and measure its reflectance from the target surface. We make our measurement from the attributes of the reflected signal. Three very typical active remote sensing instruments are radar (radio detection and ranging) using radio waves, lidar (light detection and ranging) using laser, and sonar (sound navigation and ranging) using sound waves. The first dataset we download is SRTM (Shuttle Radar Topographic Mission), which is a DEM (digital elevation model) produced with a radar mounted on a space shuttle.
For this, we select the Digital Elevation item and then SRTM. Under the SRTM menu, there are some different datasets from which we need the 1 Arc-Second Global. Finally, we push the Results button, which navigates us to the results of our query. In the results window, there are quite a few options for every item, as shown in the following screenshot:
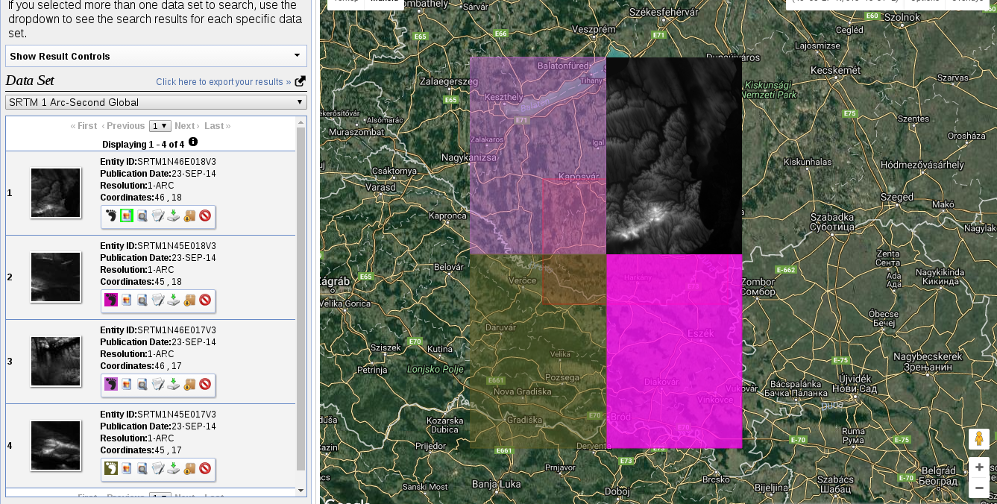
The first two options (Show Footprint and Show Browse Overlay) are very handy tools to show the selected imagery on the map. The footprint only shows the enveloping rectangle of the data, therefore, it is fast. Additionally, it colors every footprint differently, so we can identify them easily. The overlay tool is handy for getting a glance at the data without downloading it.
Finally, we download the tiles covering our study area. We can download them individually with the item's fifth option called Download Options. This offers some options from which we should select the BIL format as it has the best compression rate, thus, our download will be fast.
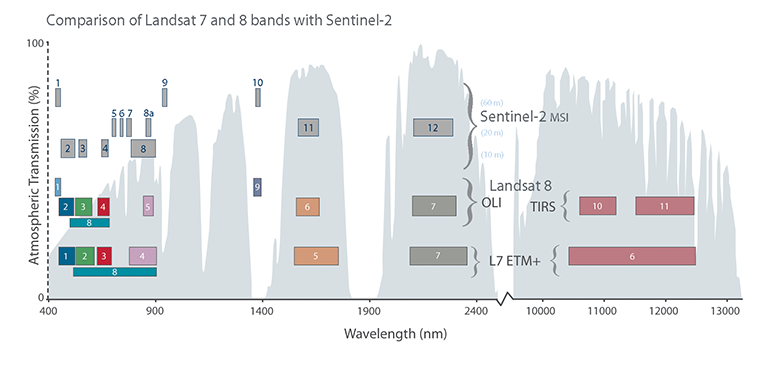
Let's get back to the Data Sets tab and select the next type of data we need to download--the Landsat data. These are measured with instruments of the other type--passive remote sensing. In passive remote sensing, we don't emit any signal, just record the electromagnetic radiance of our environment. This method is similar to the one used by our digital cameras except those record only the visible spectrum (about 380-450 nanometers) and compose an RGB picture from the three visible bands instantly. The Landsat satellites use radiometers to acquire multispectral images (bands). That is, they record images from spectral intervals, which can penetrate the atmosphere, and store each of them in different files. There is a great chart created by NASA (http://landsat.gsfc.nasa.gov/sentinel-2a-launches-our-compliments-our-complements/) which illustrates the bands of Landsat 7, Landsat 8, and Sentinel-2 along with the atmospheric opacity of the electromagnetic spectrum:
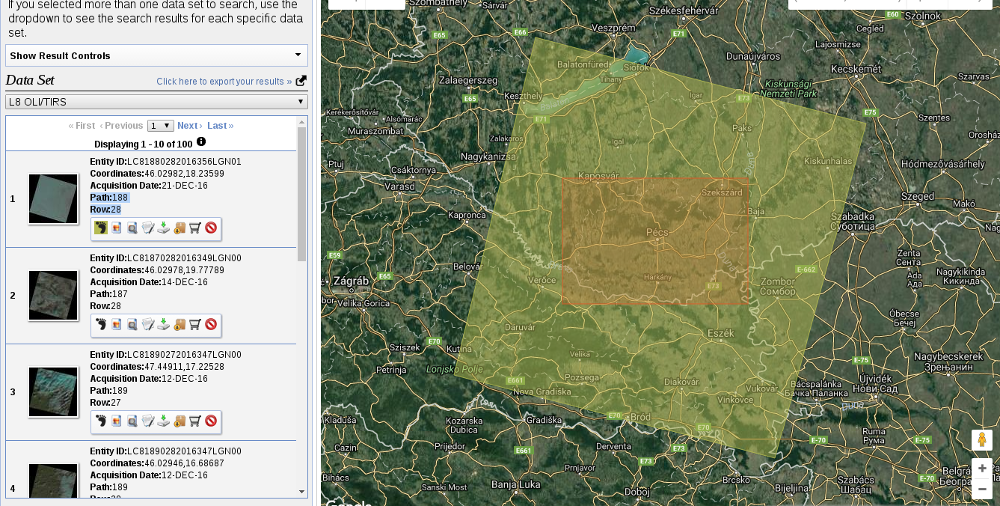
From the Landsat Archive, we need the Pre-Collection menu. From there, we select L8 OLI/TIRS and proceed to the results. With the footprints of the items, let's select an image which covers our study area. As Landsat images have a significant amount of overlap, there should be one image which, at least, mostly encases our study area. There are two additional information listed in every item--the row number and the path number. As these kinds of satellites are constantly orbiting Earth, we should be able to use their data for detecting changes. To assess this kind of use case (their main use case), their orbits are calculated so that, the satellites return to the same spot periodically (in case of Landsat, 18 days). This is why we can classify every image by their path and row information:
Note
To make sure the images are illuminated the same way every time on a given path/row, this kind of satellite is set on a Sun-synchronous orbit. This means, they see the same spot at the same solar time in every pass. There is a great video created by NASA visualizing Landsat's orbit at https://www.youtube.com/watch?v=P-lbujsVa2M.
Let's note down the path and row information of the selected imagery and go to the Additional Criteria tab. We feed the path and row information to the WRS Path and WRS Row fields and go back to the results. Now the results are filtered down, which is quite convenient as the images are strongly affected by weather and seasonal effects. Let's choose a nice imagery with minimal cloud coverage and download its Level 1 GeoTIFF Data Product. From the archive, we will need the TIFF files of bands 1-6.
SRTM is in the public domain; therefore, it can be used without restrictions, and giving attribution is also optional. Landsat data is also open source; however, based on USGS's statement (https://landsat.usgs.gov/are-there-any-restrictions-use-or-redistribution-landsat-data), proper attribution is recommended.
The last dataset we put our hands on is the swiss army knife of open source GIS data. OpenStreetMap provides vector data with a great global coverage coming from measurements of individual contributors. OpenStreetMap has a topological structure; therefore, it's great for creating beautiful visualizations and routing services. On the other hand, its collaborative nature makes accuracy assessments hard. There are some studies regarding the accuracy of the whole data, or some of its subsets, but we cannot generalize those results as accuracy can greatly vary even in small areas.
One of the main strengths of OpenStreetMap data is its large collection and variety of data themes. There are administrative borders, natural reserves, military areas, buildings, roads, bus stops, even benches in the database. Although its data isn't surveyed with geodesic precision, its accuracy is good for a lot of cases: from everyday use to small-scale analysis where accuracy in the order of meters is good enough (usually, a handheld GPS has an accuracy of under 5 meters). Its collaborative nature can also be evaluated as a strength as mistakes are corrected rapidly and the content follows real-world changes (especially large ones) with a quick pace.
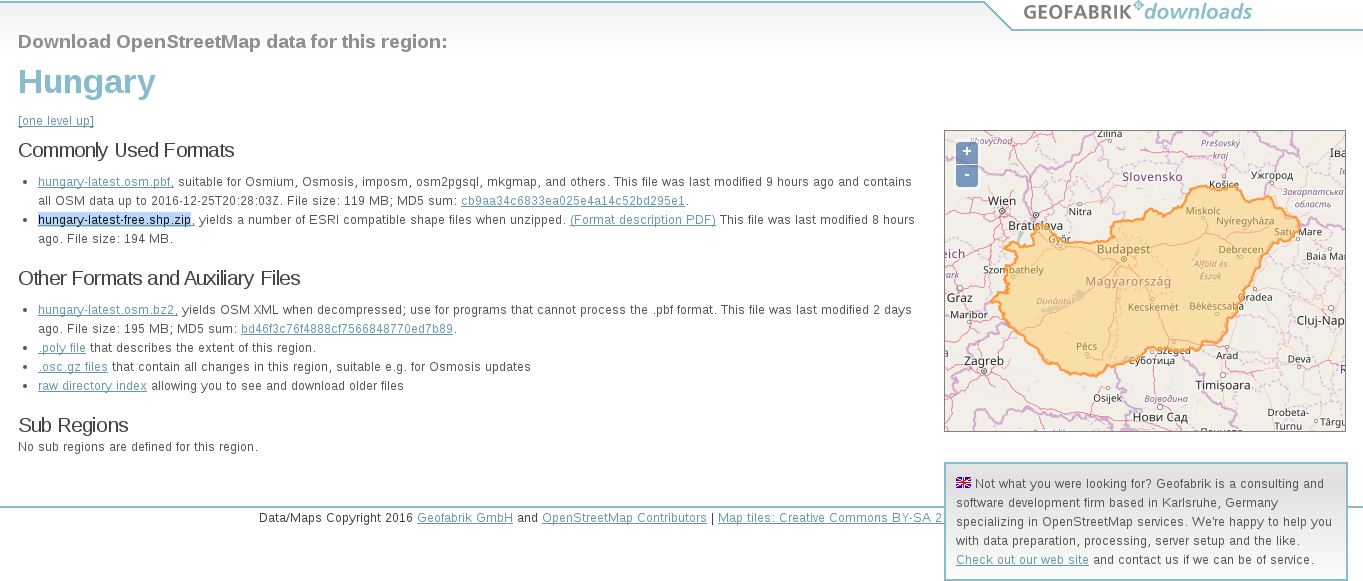
Accessing OpenStreetMap data can be tricky. There are some APIs and other means to query OSM, although either we need to know how to code or we get everything in one big file. There is one peculiar company which creates thematic data extracts from the actual content--Geofabrik. We can reach Geofabrik's download portal at http://download.geofabrik.de/. It allows us to download data in OSM's native PBF format (Protocolbuffer Binary Format), which is great for filling a PostGIS database with OSM data from the command line on a Linux system but cannot be opened with a desktop GIS client. It also serves XML data, which is more widely supported, but the most useful extracts for us are the shapefiles.
Note
There are additional providers creating extracts from the OpenStreetMap database. For example, Mapzen's Metro Extracts service can create full extracts for a user-defined city sized area. You just have to register, and use the service at https://mapzen.com/data/metro-extracts/. You might need additional tools, out of the scope of this book, to effectively use the downloaded data though.
Due to various reasons, open source shapefiles are only exported by Geofabrik for small areas. We have to narrow down our search by clicking on links until the shapefile format (.shp.zip) is available. This means country-level extracts for smaller countries and regional extracts for larger or denser ones. The term dense refers to the amount of data stored in the OSM database for a given country. Let's download the shapefile for the smallest region enveloping our study area:
OpenStreetMap data is licensed under ODbL, an open source license, and therefore gives the four basic freedoms. However, it has two important conditions. The first one is obligatory attribution, while the second one is a share-alike condition. If we use OpenStreetMap data in our work, we must share the OSM part under an ODbL-compatible open source license.
ODbL differentiates three kind of products: collective database, derived database, and produced work. If we create a collective database (a database which has an OSM part), the share-alike policy only applies on the OSM part. If we create a derived database (make modifications to the OSM database), we must make the whole thing open source. If we create a map, a game, or any other work based on the OSM database, we can use any license we would like to. However, if we modify the OSM database during the process, we must make the modifications open source.
Note
If the license would only have these rules, it could be abused in infinitesimal ways. Therefore, the full license contains a lot more details and some clauses to avoid abuses. You can learn more about ODbL at https://wiki.osmfoundation.org/wiki/Licence.
In this chapter, we installed the required open source GIS software, configured some of them, and downloaded a lot of open source data. We became familiar with open source products, licenses, and data sources. Now we can create an open source GIS working environment from zero and acquire some data to work with. We also gained some knowledge about data collection methods and their nature.
In the next chapter, we will visualize the downloaded data in QGIS. We will learn to use some of the most essential functionalities of a desktop GIS client while browsing our data. We will also learn some of the most basic attributes and specialities of different data types in GIS.


