Download code from GitHub
This book will cover all of the exam objectives for the AZ-300 exam. When relevant, we will provide you with extra information and further reading guidance about the different topics of this book.
This chapter introduces the first objective, which is going to cover the Deploy and Configure Infrastructure. It will cover Azure Monitor and the various aspects of it. You will learn how to create and analyze metrics and alerts and how to create a baseline for resources. We are going to look at how to create action groups and how to configure diagnostic settings on resources. Finally, we are going to cover Azure Log Analytics and how to utilize log search query functions.
The following topics will be covered in this chapter:
- Understanding Azure Monitor
- Creating and analyzing metrics and alerts
- Creating a baseline for resources
- Configuring diagnostic settings on resources
- Viewing alerts in Log Analytics
- Utilizing log search query functions
Understanding Azure Monitor
Azure Monitor is a monitoring solution in the Azure portal that delivers a comprehensive solution for collecting, analyzing, and acting on telemetry from the cloud and on-premises environments. It can be used to monitor various aspects (for instance, the performance of applications) and identify issues affecting those applications and other resources that depend on them.
The data that is collected by Azure Monitor fits into two fundamental types: metrics and logs. Metrics describe an aspect of a system at a particular point in time and are displayed in numerical values. They are capable of supporting near real-time scenarios. Logs are different from metrics. They contain data that is organized into records, with different sets of properties for each type. Data such as events, traces, and performance data are stored as logs. They can then be combined for analysis purposes.
Azure Monitor supports data collection from a variety of Azure resources, which are all displayed on the overview page in the Azure portal. Azure Monitor provides the following metrics and logs:
- Application monitoring data: This will consist of data about the functionality and performance of the application and the code that is written, regardless of its platform.
- Guest OS monitoring data: This will consist of data about the operating system on which your application is running. This could be running in any cloud or on-premises environment.
- Azure resource monitoring data: This will consist of data about the operation of an Azure resource.
- Azure subscription monitoring data: This will consist of data about the operation and management of an Azure subscription, as well as data about the health and operation of Azure itself.
- Azure tenant monitoring data: This will consist of data about the operation of tenant-level Azure services, such as Azure Active Directory.
The following diagram gives a high-level view of Azure Monitor. On the left, there are the sources of monitoring data, in the center are the data stores, and on the right are the different functions that Azure Monitor performs with this collected data, such as analysis, alerting, and streaming to external systems:

Now that we have some basic knowledge about Azure Monitor, we are going to look at how to analyze alerts and metrics across subscriptions.
Creating and analyzing metrics and alerts
To analyze alerts and metrics across Azure Monitor, we need to go to the monitoring resource inside the Azure portal. In the upcoming sections, we will set up metrics and alerts and show you how to analyze them.
Metrics
Metrics describe an aspect of a system at a particular point in time and are displayed in numerical values. They are collected at regular intervals and are identified with a timestamp, a name, a value, and one or more defining labels. They are capable of supporting near real-time scenarios and are useful for alerting. Alerts can be fired quickly with relatively simple logic.
Metrics in Azure Monitor are stored in a time-series database that is optimized for analyzing timestamped data. This makes metrics suited for the fast detection of issues. They can help to detect how your service or system is performing, but to get the overall picture, they typically need to be combined with logs to identify the root cause of issues.
You can use metrics for the following scenarios:
- Analyzing: Collected metrics can be analyzed using a chart in Metric Explorer. Metrics from various resources can be compared as well.
- Visualizing: You can create an Azure Monitor workbook to combine multiple datasets into an interactive report. Azure Monitor workbooks can combine text, Azure metrics, analytics queries, and parameters into rich interactive reports.
- Alerting: Metric alert rules can be configured to send out notifications to the user. They can also take automatic action when the metric value crosses a threshold.
- Automating: To increase and decrease resources based on metric values that cross a threshold, autoscaling can be used.
- Exporting: Metrics can be streamed to an Event Hub to route them to external systems. Metrics can also be routed to logs in the Log Analytics workspace, to be analyzed together with the Azure Monitor logs and to store the metric values for more than 93 days.
- Retrieving: Metric values can be retrieved from a command line using PowerShell cmdlets and the CLI, and from custom applications using the Azure Monitoring REST API.
- Archiving: Metric data can be archived in Azure Storage. It can store the performance or health history of your resource for compliance, auditing, or offline reporting purposes.
There are four main sources of metrics that are collected by Azure Monitor. Once they are collected and stored in the Azure Monitor Metric database, they can be evaluated together regardless of their source:
- Platform metrics: These metrics give you visibility of the health and performance of your Azure resources. Without any configuration required, a distinct set of metrics is created for each type of Azure resource. By default, they are collected at a one-minute frequency. However, you can configure them to run on a different frequency as well.
- Guest OS metrics: These metrics are collected from the guest operating system of a virtual machine. To enable guest OS metrics for Windows machines, the Windows Diagnostic Extension agent needs to be installed. For Linux machines, the InfluxData Telegraf Agent needs to be installed.
- Application metrics: These metrics are created by Application Insights. They can help to detect performance issues for your custom applications and track trends in how the application is being used.
- Custom metrics: These are metrics that you define manually. You can define them in your custom applications that are monitored by Application Insights or you can define custom metrics for an Azure service using the custom metrics API.
Multi-dimensional metrics
Metric data often has limited information to provide context for collected values. This challenge is addressed by Azure Monitor using multi-dimensional metrics. The dimensions of the metrics are name-value pairs that store additional data that describe the metric value. For example, a metric called available disk space could have a dimension called Drive with the values C:, D, stored inside. This value would allow the viewing of available disk space across all drives, or for each drive individually.
In the next section, we are going to create a metric in the Azure portal.
Creating a metric
To display the metrics for the various Azure resources in Azure Monitor, perform the following steps:
- Navigate to the Azure portal by opening https://portal.azure.com.
- In the left-hand menu, select Monitor to open the Azure Monitor overview blade.
- First, we're going to look at metrics. Therefore, in the left-hand menu, select Metrics or select the Explore Metrics button from the overview blade.
- In the Metrics overview blade, click on the + Select a scope button. A new blade will open up where you can select the subscription, the resource group, and the resource type. Select the subscription that is used for the Linux VM, select the resource group, and then select the VM. You can filter by other resource types, as well:

- Click on Apply.
- Then, you can select the metric type. Select CPU Credits Consumed, for instance:
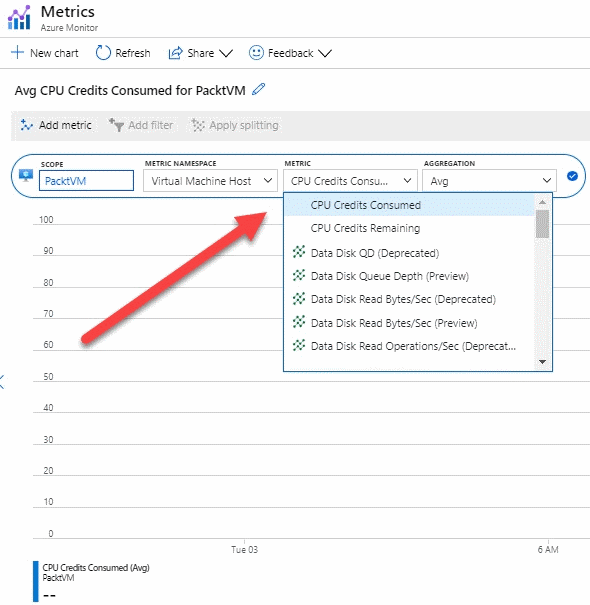
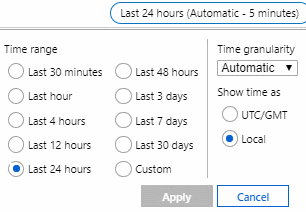
- You can select a different type of aggregation as well, such as the count, average, and more, in the filter box. At the top-right of the blade, you can select a different time range for your metric as well:
- You can also pin this metric to the overview dashboard in the Azure portal. Therefore, click on the Pin to dashboard button, and then choose to pin it to the current dashboard or create a new dashboard for it. For now, select Pin to current dashboard:
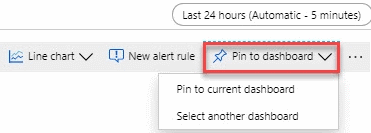
- If you now select Dashboard from the left-hand menu, you'll see that this metric is added to it. This way, you can easily analyze this metric without the need to open Azure Monitor.
In the next section, we're going to look at how to set up and analyze alerts in Azure Monitor.
Alerts
With alerts, Azure can proactively notify you when critical conditions occur in the Azure or on-premises environment. Alerts can also attempt to take corrective actions automatically. Alert rules that are based on metrics will provide near real-time alerting, based on the metric. Alerts that are created based on logs can merge data from different resources together.
The alerts in Azure Monitor use action groups, which are unique sets of recipients and actions that can be shared across multiple rules. These action groups can use Webhooks to start external actions, based on the requirements that are set up for this alert. These external actions can then be picked up by different Azure resources, such as Runbooks, Functions, or Logic Apps. Webhooks can also be used for adding these alerts to external IT Service Management (ITSM) tools.
You can also set alerts for all of the different Azure resources. In the following sections, we are going to create an alert.
Creating an alert and an action group
To create an alert, perform the following steps:
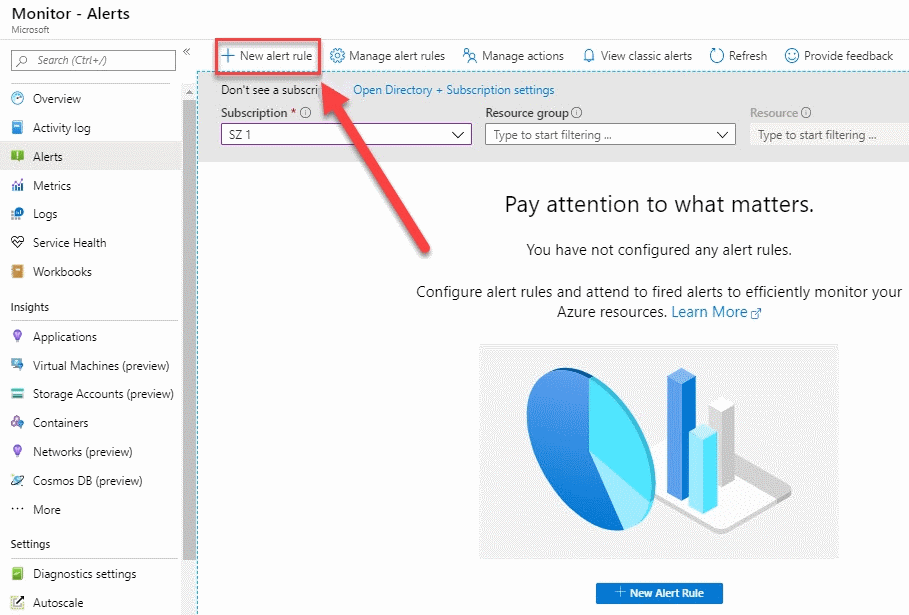
- From the Azure Monitor overview blade, in the left-hand menu, select Alerts. You can also go to the alerts settings by clicking on Create alert to create an alert directly.
- In the Alerts blade, click on + New alert rule in the top menu:
- The Create rule blade is displayed. Here, you can create the rule and action groups. To create a new rule, you need to first select the resource. Click on the Select button under the RESOURCE section:
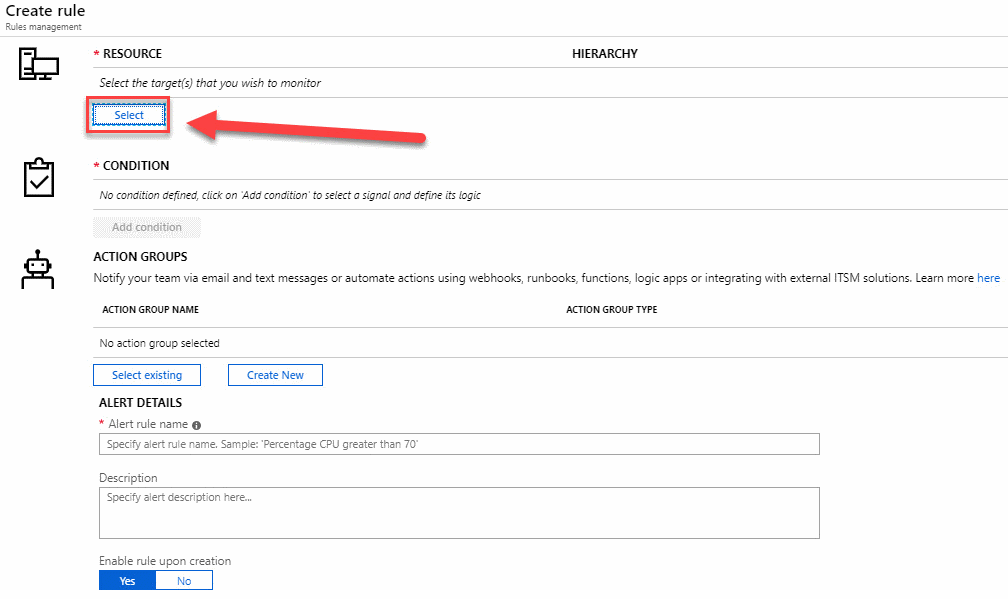
- In the next blade, you can filter by the subscription and resource type. Select Virtual machines:
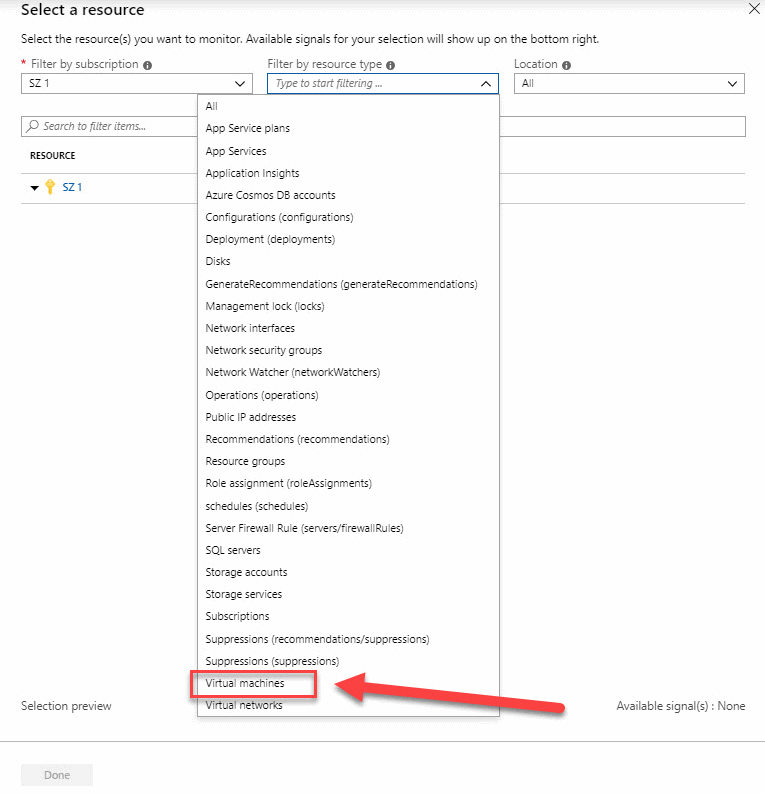
- Select the VM from the list and click Done.
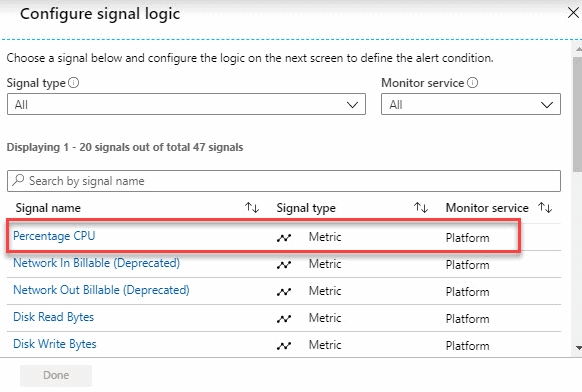
- Now that we have a resource selected, we're going to set up the condition. Click on Add condition.
- The condition blade is open, and so we can filter by a certain signal. Select Percentage CPU and click Done:
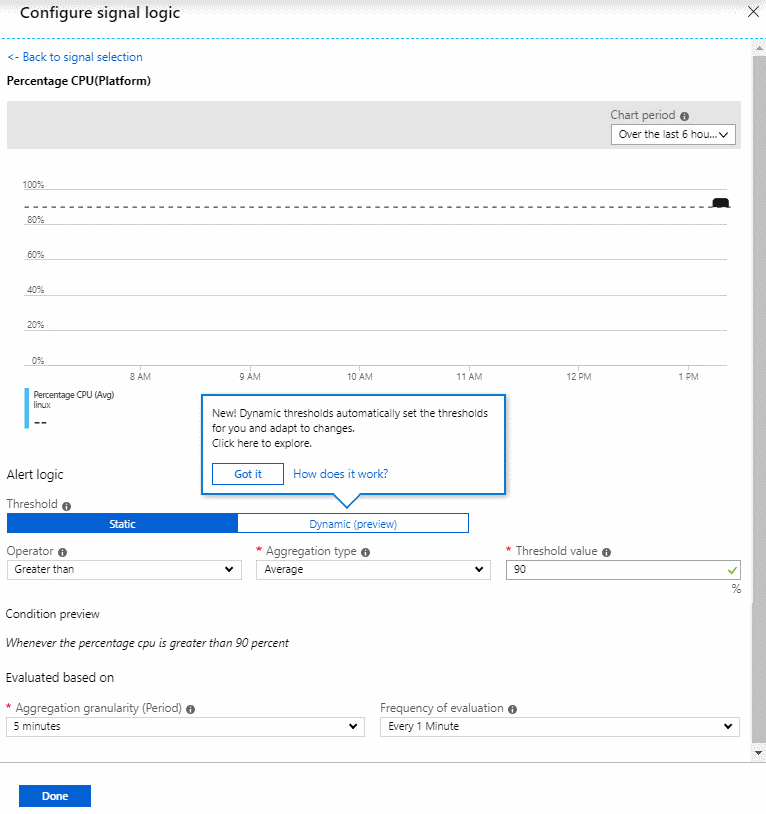
- Next, you can set the alert logic for this alert. You can choose multiple operators, set the aggregation type, and set the threshold value for this alert. Set the following:
- Threshold: Static (in the next section, we are going to cover the difference between static and dynamic thresholds)
- Operator: Greater than
- Aggregation type: Average
- Threshold Value: 90%
- Leave Evaluated based on with its default settings.
- This alert will notify you when the CPU of the virtual machines is greater than 90% over a 5-minute period. Azure Monitor will check this every minute:
- Click on Done to create this condition.
- Now, we have to create an action group to send the alert to. This is then responsible for handling the alert and taking further action on it. The action group that you create here can be reused across other alerts as well. So, in our case, we will create an email action group that will send out an email to a certain email address. After its creation, you can add this existing action group to other alerts. Under Action group, select the Create new button.
- In the Action Group blade, add the following settings:
- Action group name: Type Send email.
- Short name: Type email.
- Subscription: Select the subscription where the VM is created.
- Resource group: Select Default-ActivityLogAlerts (to be created).
- Then, we have to provide the actual action. Add the following values:
- Action name: email
- Action type: Email/SMS/Push/Voice
- Then, select Edit details and select the Email checkbox. Provide an email address and click on the OK button:
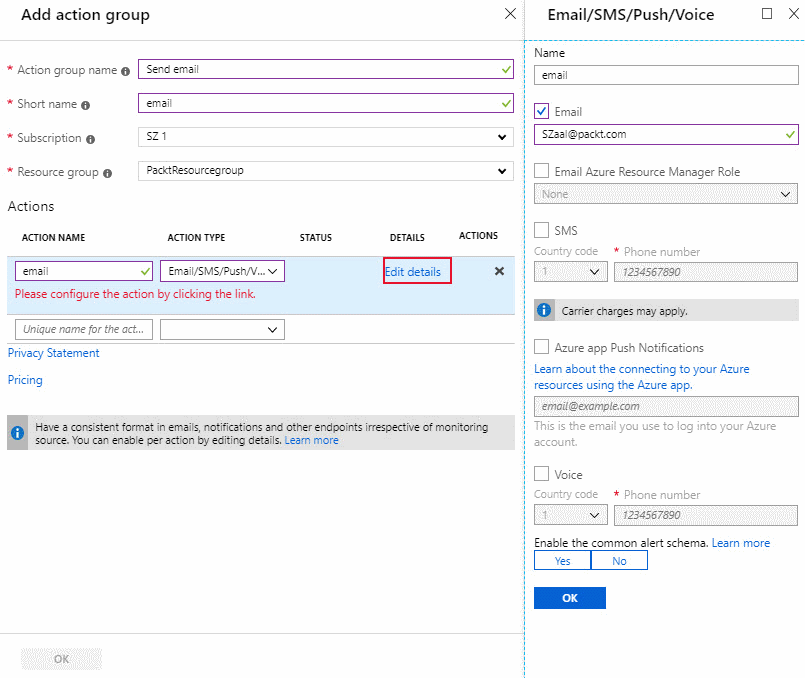
- Click on OK again.
- Finally, you have to specify an alert name, set the severity level of the alert, and click on Create alert rule:
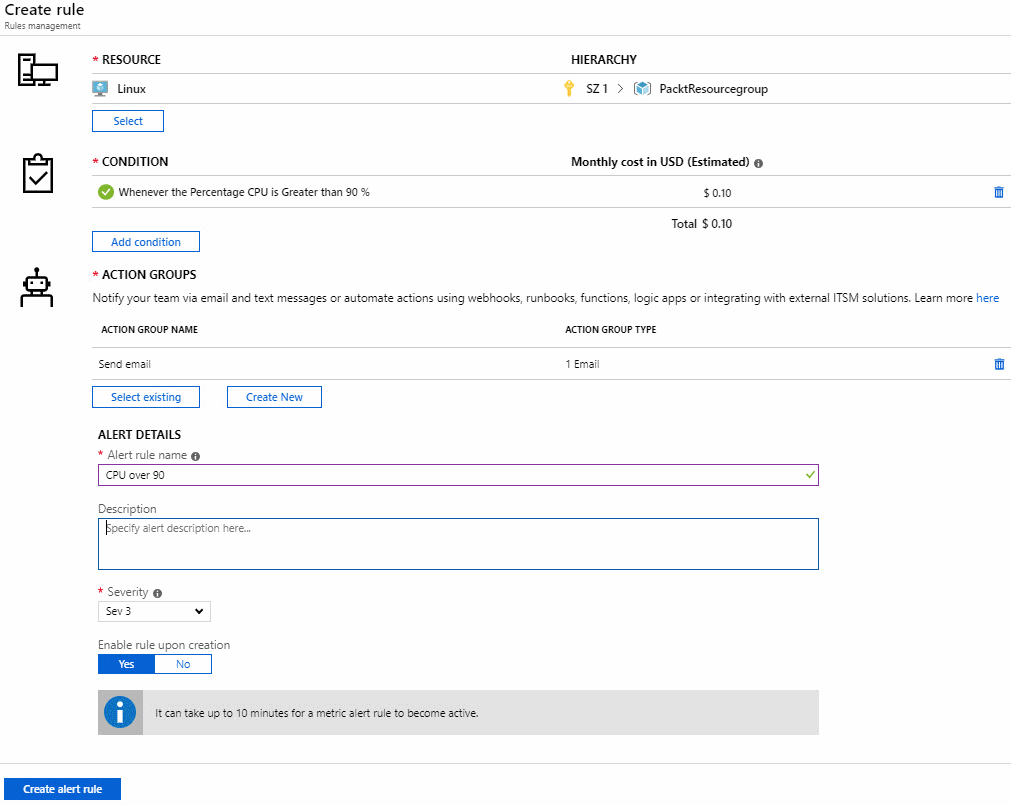
We have now created an alert and an action group that will alert a user via email when the CPU goes over 90%. In the next section, we're going to create a baseline for resources.
Creating a baseline for resources
To create a baseline for your resources, Azure offers Metric Alerts with Dynamic Thresholds. Using Dynamic Thresholds, you don't have to manually identify and set thresholds for alerts, which is an enhancement to Azure Monitor Metric Alerts. Advanced machine learning capabilities are used by the alert rule to learn the historical behavior of the metrics while identifying patterns and anomalies that indicate possible service issues. With Dynamic Thresholds, you can create an alert rule once and apply it automatically to different Azure resources during the creation of the resources.
In the following overview, you will find some scenarios when Dynamic Thresholds to metrics alerts are recommended:
- Scalable alerting: Dynamic Thresholds are capable of creating tailored thresholds for hundreds of metric series at a time. However, this is as easy as creating an alert rule for one single metric. They can be created using the Azure portal or Azure Resource Manager (ARM) templates and the ARM API. This scalable approach is useful when applying multiple resources or dealing with metric dimensions. This will translate to a significant time-saving on the creation of alert rules and management.
- Intuitive Configuration: You can set up metric alerts using high-level concepts with Dynamic Thresholds, so you don't need to have extensive domain knowledge about the metric.
- Smart Metric Pattern Recognition: By using a unique machine learning technology, Azure can automatically detect metric patterns and adapt to metric changes over time. The algorithm used in Dynamic Thresholds is designed to prevent wide (low recall) or noisy (low precision) thresholds that don't have an expected pattern.
In the next section, we're going to configure diagnostic settings on resources.
Configuring diagnostic settings on resources
You can also configure diagnostic settings on different Azure resources. There are two types of diagnostic logs available in Azure Monitor:
- Tenant logs: These logs consist of all of the tenant-level services that exist outside of an Azure subscription. An example of this is the Azure Active Directory logs.
- Resource logs: These logs consist of all of the data from the resources that are deployed inside an Azure subscription, for example, virtual machines, storage accounts, and network security groups.
The contents of the resource logs are different for every Azure resource. These logs differ from guest OS-level diagnostic logs. To collect OS-level logs, an agent needs to be installed on the virtual machine. The diagnostic logs don't require an agent to be installed; they can be accessed directly from the Azure portal.
The logs that can be accessed are stored inside a storage account and can be used for auditing or manual inspection purposes. You can specify the retention time in days by using the resource diagnostic settings. You can also stream the logs to event hubs to analyze them in Power BI or insert them into a third-party service. These logs can also be analyzed with Azure Monitor. Then, there will be no need to store them in a storage account first.
Enabling diagnostic settings
To enable the diagnostic settings for resources, perform the following steps:
- Navigate to the Azure portal by opening https://portal.azure.com.
- Go to the VM again. Make sure that the VM is running, and in the left-hand menu, under Monitoring, select Diagnostic settings.
- The Diagnostic Settings blade will open up. You will need to select a storage account where the metrics can be stored.
- Click on the Enable guest-level monitoring button to update the diagnostic settings for the virtual machine:
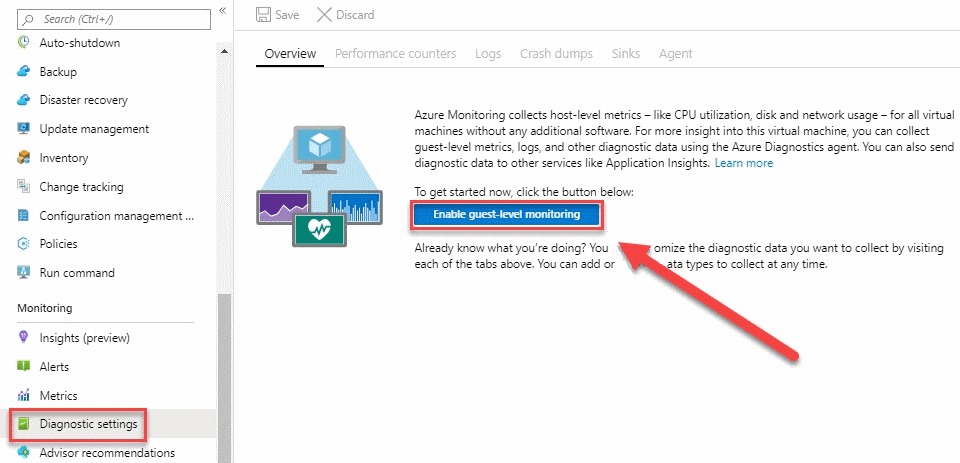
- When the settings are updated, you can go to Metrics in the top menu to set the metrics that are collected. The syslog blade is used for setting the minimum log level.
- New metrics will be available from the metrics blade after enabling diagnostic logging in Azure Monitor. You can analyze them in the same way that we did earlier in this chapter, in the Metrics section.
In the next section, we're going to look at the Azure Log Analytics service, which is now a part of Azure Monitor as well.
Viewing alerts in Log Analytics
Azure Log Analytics is a service that collects telemetry data from various Azure resources and on-premises resources. All of that data is stored inside a Log Analytics workspace, which is based on Azure Data Explorer. It uses the Kusto query language, which is also used by Azure Data Explorer to retrieve and analyze the data.
Analyzing this data can be done from Azure Monitor. All of the analysis functionalities are integrated there. The term Log Analytics now primarily applies to the blade in the Azure portal where you can analyze metric data.
Before we can display, monitor, and query the logs from Azure Monitor, we need to create a Log Analytics workspace. For that, we have to perform the following steps:
- Navigate to the Azure portal by opening https://portal.azure.com.
- Click on Create a resource.
- Type Log Analytics in the search box and create a new workspace.
- Add the following values:
- Log Analytics workspace: Type PacktWorkspace (the name for this Log Analytics workspace needs to be unique; if the name is already taken, specify another name).
- Subscription: Select a subscription.
- Resource group: Create a new one and call it PacktWorkspace.
- Location: Select West US.
- Pricing tier: Keep the default one, which is per GB.
- Click on the OK button to create the workspace.
Now that we have created a Log Analytics workspace, we can use it inside Azure Monitor to create some queries to retrieve data. We will do this in the next section.
Utilizing log search query functions
Azure Monitor is now integrated with the features and capabilities that Log Analytics was offering. This also includes creating search queries across the different logs and metrics by using the Kusto query language.
To retrieve any type of data from Azure Monitor, a query is required. Whether you are configuring an alert rule, analyzing data in the Azure portal, retrieving data using the Azure Monitor Logs API, or being notified of a particular condition, a query is used.
The following list provides an overview of all of the different ways queries are used by Azure Monitor:
- Portal: From the Azure portal, interactive analysis of log data can be performed. In there, you can create and edit queries and analyze the results in a variety of formats and visualizations.
- Dashboards: The results of a query can be pinned to a dashboard. This way, results can be visualized and shared with other users.
- Views: By using the View Designer in Azure Monitor, you can create custom views of your data. This data is provided by queries as well.
- Alert rules: Alert rules are also made up of queries.
- Export: Exports of data to Excel or Power BI are created with queries. The query defines the data to export.
- Azure Monitor Logs API: The Azure Monitor Logs API allows any REST API client to retrieve log data from the workspace. The API request includes a query to retrieve the data.
- PowerShell: You can run a PowerShell script from a command line or an Azure Automation runbook that uses Get-AzOperationalInsightsSearchResults to retrieve log data from Azure Monitor. You need to create a query for this cmdlet to retrieve the data.
In the following section, we are going to create some queries to retrieve data from the logs in Azure Monitor.
Querying logs in Azure Monitor
To query logs in Azure Monitor, perform the following steps:
- Navigate to the Azure portal by opening https://portal.azure.com.
- In the left-hand menu, select Monitor to open the Azure Monitor overview blade. Under Insights, select More. This will open the Log Analytics workspace that we created in the previous step.
- On the overview page, click on Logs in the top menu. This will open the Azure Monitor query editor:

- Here, you can select some default queries. They are displayed at the bottom part of the screen. There are queries for retrieving unavailable computers, the last heartbeat of a computer, and much more. Add the following queries to the query editor window to retrieve data:
-
- This query will retrieve the top 10 computers with the most error events over the last day:
Event | where (EventLevelName == "Error") | where (TimeGenerated > ago(1days)) | summarize ErrorCount = count() by Computer | top 10 by ErrorCount desc
-
- This query will create a line chart with the processor utilization for each computer from the last week:
Perf | where ObjectName == "Processor" and CounterName == "% Processor Time" | where TimeGenerated between (startofweek(ago(7d)) .. endofweek(ago(7d)) ) | summarize avg(CounterValue) by Computer, bin(TimeGenerated, 5min) | render timechart
Summary
In this chapter, we covered the first objective of the Deploy and Configure Infrastructure objective. We covered the various aspects of Azure Monitor and how you can use metrics to monitor all of your Azure resources and alerts to get notified when certain things are happening with your Azure resources. We also used Azure Log Analytics and created queries so that we could get valuable data out of the logs.
In the next chapter, we will cover the second part of this exam objective. In that chapter, we will cover how to create and configure storage accounts.
Questions
Answer the following questions to test your knowledge of the information in this chapter. You can find the answers in the Assessments section at the end of this book:
- Is Azure Log Analytics now a part of Azure Monitor?
- Yes
- No
- Suppose that you want to create a query to retrieve specific log data from a virtual machine. Do you need to write a SQL statement to retrieve this?
- Yes
- No
- Are action groups used to enable metrics for Azure Monitor?
- Yes
- No
Further reading
You can check out the following links for more information about the topics that were covered in this chapter:
- Azure Monitor overview: https://docs.microsoft.com/en-us/azure/azure-monitor/overview
- Azure Resource logs overview: https://docs.microsoft.com/en-us/azure/azure-monitor/platform/diagnostic-logs-overview
- Overview of log queries in Azure Monitor: https://docs.microsoft.com/en-us/azure/azure-monitor/log-query/log-query-overview
- Create custom views by using View Designer in Azure Monitor: https://docs.microsoft.com/en-us/azure/azure-monitor/platform/view-designer