


Microsoft Dynamics GP 2013 is a terrific enterprise reporting package. But when it comes to analyzing data, few tools can compare to the power of Microsoft Excel. When you put the two together and use Microsoft Excel to analyze the data collected in Dynamics GP, you can build something magical. By magical, I mean a dashboard that the CFO keeps asking about. Together, we will explore using the power of Excel 2013 and GP 2013 to build a straightforward dashboard.
We are going to build a great-looking, financial-oriented dashboard. Don't worry; we won't be doing any programming, and there are no Excel macros. This dashboard is built using nothing but native Excel functionality such as charts, pivot tables, and conditional formatting.
Before we can build a great Excel-based dashboard, using the data in Dynamics GP 2013, we have to get the data out of GP and into Excel. This chapter covers nine major ways to get data from Dynamics GP into Excel with a few extra options thrown in at the end. Some of these methods pull data from the interface in Dynamics GP; others bypass the interface and pull data directly from SQL Server. Generally dashboards are designed to pull from the database for the best performance, but sometimes you have to use what you have access to. In Chapter 2, The Ultimate GP to Excel Tool: Refreshable Excel Reports, we will start building the dashboard using my favorite way to get data out of Dynamics GP refreshable Excel reports.
By the end of this chapter you should be able to get data into Excel using:
SmartList exports
SmartList Export Solutions
Navigation List Exports
Report Writer
Microsoft Query
SQL Server Reporting Services
Management Reporter
SQL Server Management Studio
Analysis Cubes
We will briefly look at some third-party options, and you'll also learn about licensing requirements around using Dynamics GP 2013 data with Microsoft Excel.
Exporting from a SmartList to Excel is the easiest and most commonly used method in Dynamics GP to get data to Microsoft Excel. We'll practice with an Account Summary SmartList.
To export from a SmartList to Excel, follow these steps:
In Dynamics GP 2013, select Microsoft Dynamics GP | SmartList.
Click on the plus sign (+) next to Financial and select Account Summary.
Once the SmartList finishes loading, click the large, green Excel button to export this SmartList to Excel.

Tip
In 2010, Microsoft revealed a previously unreleased
Dex.iniswitch that can dramatically improve the time it takes to export SmartLists to Microsoft Excel. TheDex.inifile is a launch file used to control system behavior, and this switch changes the behavior of an Excel export. Instead of sending data to Excel one line at a time, the switch tells Dynamics GP to bundle the SmartList lines together and send them to Excel as a group.This switch is unsupported and can render the results differently than the default export process. Please test this in your test system before using in production. The
Dex.inifile is located in theDatafolder of the Dynamics GP installation directory. To use this switch, add the following line to theDex.inifile and restart Dynamics GP:SmartlistEnhancedExcelExport=TRUE
While SmartList exports are great for sending Dynamics GP data to Excel for analysis, they aren't an ideal solution for a dashboard. SmartList sends data to a new Excel file each time. It's a lot of work to export data and rebuild a dashboard every month. An improved option is to use a SmartList Export Solution.
SmartList Export Solutions let you export GP data to a saved Excel workbook. They also provide the option to run an Excel macro before and/or after the data populates in Excel. As an example, we will format the header automatically after exporting financial summary information.
We have a little setup work to do for this one first. Since these exports are typically repetitive, the setup is worth the effort. Here is how it's done:
Select the Microsoft Dynamics GP menu from the top and click on SmartList.
Select Financial | Account Summary on the left to generate a SmartList.
Click on the Excel button to send the SmartList to Excel.
Next, we need to turn on the Developer Ribbon in Excel:
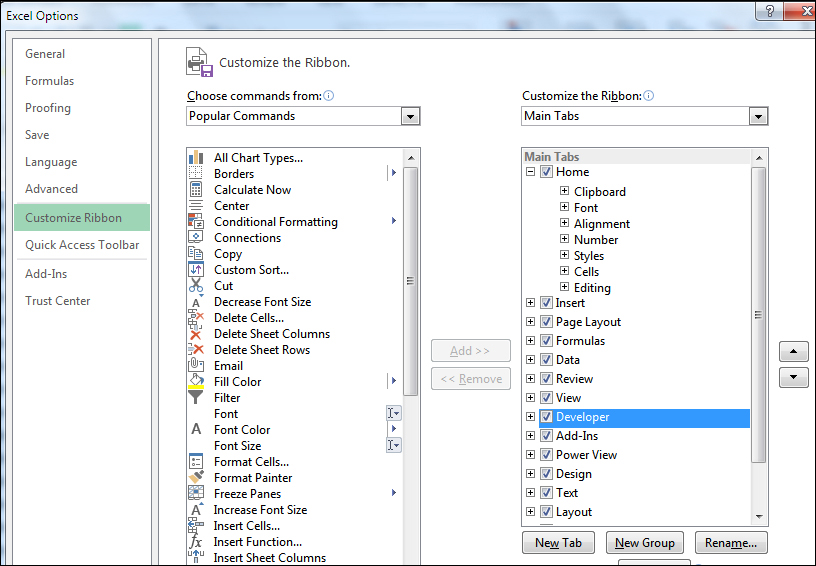
A SmartList Export Solution allows you to run an Excel macro before or after the data arrives to format or manipulate the information so you only have to do it once. Let's record our Excel macro.
Click on the Developer tab and select Record Macro. Accept the default name of Macro1 and click OK.

In Excel 2013, highlight Rows 1-5, right-click, and select Insert.
Bold the titles in cells A6-F6 by highlighting them and clicking the B icon on the Home ribbon.
In cell A1 enter
Sample Excel Solution.From the Developer tab, select Stop Recording.
Highlight and delete all the rows.
Save the blank file containing just the macro on the C: with the name as
AccountSummary.xlsm.
Now that we've prepared our Excel 2013 workbook to receive a SmartList, we need to set up and run the SmartList Export Solution:
In Dynamics GP, select Microsoft Dynamics GP and then select SmartList.
Select Financial | Account Summary in the left pane to generate a SmartList.
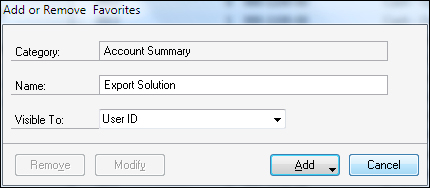
Click on Favorites. Name the favorite Export Solution and click Add | Add Favorite. The favorite can be named anything. I'm using Export Solution for our example:
Back on the SmartList window, select SmartList | Export Solutions. Name the solution as
Export Solution. Set the path toC:\AccountSummary.xlsmand the completion macro toMacro1.Check the box next to the SmartList favorite under Account Summary named Export Solution:

Click Save and close the window.
Back in the SmartList window, select the Export Solution favorite under Account Summary and click on the Excel button.
Instead of immediately opening Excel, there are now two options. The Quick Export option performs a typical Excel export. We want the second option. Click on the Export Solutions option. This will open the Excel file named
AccountSummary.xlsm, export the data, and run the macro namedMacro1, all with one click.
Click on the Export Solution option and watch the file open and the macro execute:

Dynamics GP includes a feature called Navigation Lists. These lists provide centralized information views and access to tasks around common areas. For example, the Account Transactions List includes the ability to review journal entries, drill back to additional information, and enter transactions, all from a single screen.
Navigation Lists don't have a large Excel button like SmartLists, but they do include the ability to export to Excel.
To export a Navigation List to Excel:
Select Financial from the Navigation Pane.
At the top of the Navigation Pane, select Accounts to open up the Accounts list.
Check the white box in the header next to Account Number to select all the accounts.

On the ribbon at the top, select Go To | Send to Excel.
Tip
Like the
Dex.iniswitch that can improve exports to Excel from SmartLists, there is a similar, unsupported switch to speed Navigation List exports to Excel. To activate this switch, add the following line to theDex.inifile and restart Dynamics GP 2013. The same caveats apply; test this on a test server first.ListsFastExcelExport=TRUE
The core reports in Microsoft Dynamics GP 2013 are still rendered using the included Report Writer application. More and more reports are available in formats that make it easy to bring them into Excel, but sometimes the information you need is most easily accessed via a Report Writer report. This is particularly true for reports that use temporary tables as part of the report generation process.
Report Writer can't export directly to Excel, but it can export to a comma-delimited file, a tab-delimited file, or a text file, any of which can be brought into Excel.
To demonstrate getting Report Writer data in Excel:
Select Financial from the Navigation Pane.
On the Financial Area Page, select Trial Balance under the Reports section.
Change the selection under Reports to Summary.
Select demo and click Modify.
In the Year section, select Open, set the year to 2017, and click Destination.

In the Report Destination window, uncheck Printer and Screen and check only File.
Click the file folder to set a location and filename and change Save as type to Comma-delimited file.

Click Save to close the window followed by OK and then Print to generate the file.
Navigate to the location where you saved the file and double-click the file name to open it in Excel.
For longer reports, you may need to sort the report to push page headers and footers together to make it easier to delete them.
Tip
On some reports, a single line of data won't fit on one printed line. In this case Dynamics GP wraps the line. This makes exporting these reports to Dynamics GP difficult. To prevent line-wrapping, add this setting to the Dex.ini file:
ExportOneLineBody=TRUE
This will force wrapped lines in the body of the report to export as a single line. This doesn't affect the headers or footers exported from Report Writer.
Microsoft Query is old technology. It's been in Microsoft Excel since at least Excel 97. It's still in Excel 2013 because it works. Microsoft Query is commonly abbreviated MS Query, and you'll see that used in this section as well.
In Chapter 2, The Ultimate GP to Excel Tool: Refreshable Excel Reports, we will look at deploying and using the refreshable Excel reports contained in Dynamics GP. For all of the power of those dynamic reports, one thing is missing—the ability to limit the data being returned from Dynamics GP based on parameters in the Excel worksheet. Excel reports allow filtering, but if a user only needs a subset of data, using filters is less efficient than simply bringing in just the required data.
Fortunately, there is another option. The MS Query tool included with Excel can work with Open Database Connectivity (ODBC) to connect to live data in Dynamics GP. What's nice about MS Query is that it:
Is fast as Excel Reports
Allows user-entered parameters
Parameters can be entered in Excel cells
Multiple parameters can be used
Only the necessary data is returned, making them very efficient
This provides incredible control for live reporting of Dynamics GP data. However, there are no prebuilt reports that use ODBC connections, so users have to build these from scratch. Also, the user's Dynamics GP connection can't be used, so a separate SQL login is required for these reports. Microsoft was planning on adding parameter functionality to the refreshable Excel reports for GP 2013, but that feature didn't make the cut. That means that MS Query will continue to be useful into the future.
To demonstrate the power of Excel queries, we'll build a simple account summary report with a user-selectable parameter using Dynamics GP and Microsoft Excel 2013.
To build a direct connection between GP and Excel:
Open Microsoft Excel 2013 and select Data | From Other Sources | From Microsoft Query. This will start the MS Query Wizard.
Select the data source used to log in to Dynamics GP. The default data source is named Dynamics GP. Click OK.
If a user's network login is set up to access SQL Server, they can just click OK. Otherwise, enter
saas the username andsaas password. Eithersaor another SQL user is required here. Encryption between the GP login and SQL Server prevents a regular Dynamics GP login from being used for this task.
Click Options and select the TWO database. Click OK to start the MS Query Wizard.
We are going to use an SQL view, so click Options and check Views. Click OK:

In the Query Wizard, scroll to the view named Account Summary. Click on the plus sign (+) to expand the columns available.

Find and select the column named Year and click on the right arrow (>) to add it to the Columns in your query box.
Repeat this process for these columns:
Period ID
Account Number
Account Description
Credit Amount
Debit Amount
Period Balance
The vertical arrow keys on the right can be used to reorder columns if necessary. Use these to move Debit Amount ahead of Credit Amount. Click Next when finished.
In the Filter Data window, select Year. In the Only include rows where: section, key
2017. Click Next to continue:
Click Next to move past the Sort screen and select View data or edit query in Microsoft Query. Click Finish to open MS Query and review the details:

Once MS Query opens, select 2017 next to Value. Change it to
[SumYear]and press Tab.
Enter
2017in the box that opens and click OK. This step changes 2017 from a value to a variable. It then inserts 2017 as the initial value for that variable.Select File | Return data to Microsoft Office Excel.
Tip
Experienced database administrators will quickly realize that they can use more complex SQL joins, views, and just about anything that they can come up with by using the SQL button in MS Query. There are some limitations though. Excel may refuse to allow parameters if the SQL query is too complex. The best option in that case is to wrap a complex query into a view to simplify it for Microsoft Query.
In the Import Data box, check Existing worksheet and enter
=A5, then click OK.The data from Dynamics GP will now show up in Excel:

Now we are ready to add the parameters. In cell A1 type
Year.In cell A2 type
2017.Click on the Year heading from the imported data. Select Data | Connections | Properties | Definition | Parameters.

Click Export Connection File and save the file to create a portable Office Data Connection file with the embedded parameter.
Select SumYear. Select Get the value from the following cell. Key in
=A2. Mark the Refresh automatically when cell value changes checkbox. Click OK and close all the other open windows:
Change the cell value in cell A2 to
2016. Press Tab and all the values in the sheet will change to reflect data from 2016:
Save the Excel file. Reopen the file and change the year back to 2017; press Tab and all the values will update to 2017.
Tip
The part that drives users crazy is figuring out what table holds the data they need. When the Dynamics GP 2013 refreshable Excel reports are deployed, they use prebuilt views such as the Account Summary view that we leveraged here. Using these views is a great place to start when building a dashboard.
The Dynamics GP community is full of suggestions and tools to assist with finding tables too. Some of the more common tools include:
The resource descriptions in GP 2013 found via Tools | Resource Descriptions
The Support Debugging Tool http://blogs.msdn.com/b/developingfordynamicsgp/archive/2009/08/07/support-debugging-tool.aspx (short Link: http://bit.ly/MSGPSDT)
The DynamicAccounting.net table resource at 08/10/lots-of-dynamics-gp-table-resources.html (short Link: http://bit.ly/GPTBLREF)
Microsoft provides prebuilt SQL Server Reporting Services (SSRS) reports as part of Dynamics GP 2013. Deploying SSRS reports is included as an option during installation, but they can also be installed later. SSRS provides an easy path to send information to Microsoft Excel 2013.
To demonstrate this, start in Dynamics GP 2013:
Select Financial from the Navigation Pane on the left.
In the List Pane above, click on Reporting Services Reports.
In the center pane, scroll down and find Trial Balance Summary.
Double-click on Trial Balance Summary to open the report.

Once the report opens in a web browser, change the following criteria:
History Year:
NoYear:
2014Starting Account Number:
000-100-00Ending Account Number:
999-999-99Starting Date:
12/31/2013Ending Date:
12/31/2014Sort By:
Account

Click View Report in the upper-right to run the Trial Balance Summary.
Select the disk icon and click Excel:

If a security bar opens at the bottom asking Do you want to open or save... select Open.
The Trial Balance Summary report now opens in Excel 2013.
Management Reporter is a financial reporting solution designed to work with all of Microsoft's Dynamics products, including Dynamics GP 2013. As of now, Management Reporter 2012 is the current release.
Management Reporter reports are typically created as part of the implementation of Dynamics GP. The creation of Management Reporter reports is outside the scope of this book, but once they've been built, it's very easy to send these reports to Excel.
The process looks like this:
Open Management Reporter and run a report, displaying it on the screen.
Select File | Export | Microsoft Excel (.xlsx):

Select the elements to export to Excel and click OK:

The export options are divided into a couple of major categories:
Export range options control what level of financial information is sent to Microsoft Excel.
Comments controls whether or not comments are included in the export.
The Microsoft Excel options section controls how the data is sent to Excel and include things such as including or excluding headers and footers.
Note
When exporting to Excel, Management Reporter exports report headers and footers to the header and footer sections respectively in Excel. It does not send headers and footers to cells. In Excel 2013, selecting Page Layout | Print Titles | Header/Footer will let you access the exported headers.
Also, Management Reporter doesn't export formulas to Excel, only values. So the total fields that are exported to Excel will not update if you change any of the numbers in the Excel worksheet. This may change in the future, but for now, you can only export values.
Microsoft Dynamics GP 2013 runs on SQL Server 2008 SP3 or later and SQL Server 2012. Some companies, in particular those with advanced users, allow read-only access to Microsoft SQL Server to make it easy for users to get just the data they want. Often this access is provided through the SQL Server Management Studio. Management Studio makes it easy to get data from GP 2013 to Microsoft Excel.
To see how easy this is:
Open SQL Server Management Studio.
Connect to the SQL Server instance with Dynamics GP 2013 installed using either Windows Authentication or SQL Server Authentication with a user ID and password. If you have access to SQL Server Management Studio, the login method and credentials will be provided by your database administrator. The user's GP login cannot be used.
Select New Query.
In the large, white box on the right type
Use TWOand hit Enter to select the sample TWO database.Type
Select * from AccountSummaryand click Execute to run the SQL query. The results will appear below the query:
Choose Edit | Select All from the menu to highlight all of the results.
Choose Edit | Copy with Headers.
Open a blank Excel 2013 sheet. On the Home tab, click on the Paste icon in the upper-left to paste the data to Microsoft Excel:

Microsoft Dynamics GP Analysis Cubes for Excel is an Online Analytical Processing (OLAP) tool from Microsoft designed for Dynamics GP. Often the name is shortened to Analysis Cubes for Excel and abbreviated as ACE.
A full implementation of Analysis Cubes for Excel is beyond the scope of this book, but Analysis Cubes are one of the best sources of data for Excel-based dashboards, so we need to spend a few minutes with them.
Analysis Cubes for Excel takes data from Dynamics GP 2013 and places it in an SQL Server-based data warehouse for use with SQL Server Analysis Services. Usually this is done once a day due to the volume of data that is being pushed through. At its simplest, a data warehouse is a separate place to store information to report off of. Often the data is optimized to improve the reporting process as it moves into the data warehouse. A multidimensional or OLAP cube not only optimizes the structure of the data to improve reporting, it can pre-calculate and aggregate information to make reporting even more powerful.
The term "data warehouse" can be scary to folks. Some companies go through painfully long data warehouse implementations with careful definition of every element and arguments over how to normalize data for consistency. Forget all of that.
The beauty of a powerful ERP system, such as Microsoft Dynamics GP, is that the database design is known, documented, and doesn't change a lot from version to version. This means that a standard data warehouse can be built that works for companies using Dynamics GP and it won't require months of work to set up.
At I.B.I.S., we can typically install, set up, and train on Analysis Cubes for a company in about five days. That's it, a fully functioning data warehouse, plus training, in a work week. The Dynamics GP Analysis Cubes product contains well designed, aggregated tables for most Dynamics GP Modules. For people using third-party add-ons, a customized cube with appropriate measures and dimensions would be required.
After you work through this book and build a few dashboards, you'll start to bump into some of the limitations of reporting directly off of Dynamics GP data. These can include placing an undue load on the GP server, difficulty in finding and joining tables, and the struggle of calculating measures by hand. You'll also want to build more complex dashboards as you grow. Using Analysis Cubes for Excel is the next logical step.
Because ACE moves data into a data warehouse for reporting, data-heavy dashboards won't put a load on Dynamics GP. Also, because Analysis Cubes pre-populates and calculates information, complex calculations are available for reporting without having to create formulas in Excel. For example, in the next screenshot, you can see Budget Variance, Current Ratio, Debit to Equity, and Gross Margin Percentage are all available in Analysis Cubes to simply drag into a pivot table for use in a dashboard; no calculation needed.

Additionally, users have the option of reporting against the data-warehouse relational database or reporting against the cubes.
From a practical standpoint, using Analysis Cubes is very similar to the process we will walk through in Chapter 2, The Ultimate GP to Excel Tool: Refreshable Excel Reports, with refreshable Excel reports. The techniques used in this book to create a dashboard also work well when building an Analysis Cube-based dashboard. Analysis Cubes for Dynamics GP is included in the starter pack in GP 2013, so customers upgrading from previous versions have an even stronger reason to implement it.
All the solutions we have discussed so far are either included with Microsoft Dynamics GP 2013 or available as additional software from Microsoft. However, if you want to work with Microsoft Dynamics GP 2013 and Microsoft Excel, there are also a number of third-party solutions available. Selecting a third-party solution can be a challenging proposition.
It seems like every vendor remotely connected to reporting and Excel has put out what they term a Business Intelligence (BI) solution for Dynamics GP. Microsoft even referred to FRx, the financial reporting forerunner to Management Reporter, as a Business Intelligence solution. This may be technically true, but when you say "Business Intelligence", the average user thinks of a dashboard, not a financial reporting package.
The market has finally shaken out into a few categories with a lot of overlap. The options break down into reporting solutions that can produce dashboards, generally known as Corporate Performance Management (CPM) solutions, and more dashboard-focused solutions that can produce financial reports. For our purposes, I'm labeling all of these solutions as Business Intelligence. It's really about where the vendor places the emphasis.
Additionally, the choices break down into those that report directly off data in Dynamics GP, those that use a just a data warehouse, and those that use OLAP cubes for their underlying data sources.
The continuum for costs and sophistication generally break down the same way. Solutions that report directly off of GP data tend to be the least sophisticated and the cheapest. Solutions using a cube tend to be more expensive and more powerful. To help, I've pulled together a list of common, third-party reporting solutions. There are other CPM and BI solutions available for Dynamics GP 2013, but since this book is focused on Excel, I've only included solutions that are Excel-focused:
|
Product |
Direct reporting |
Data warehouse |
Analysis Cube (OLAP) |
|---|---|---|---|
|
deFacto Performance Management – www.defacto.com |
No |
Yes |
Yes |
|
BI360 – www.solverusa.com |
No |
Yes |
No |
|
Vivid Reports – www.vividreports.com |
No |
Yes |
No |
|
Jet Reports – www.jetreports.com |
No |
Yes |
No |
|
Prophix – www.prophix.com |
No |
Yes |
Yes |
|
BizNet – www.biznetsoftware.com |
Yes* |
No |
No |
|
F9 – www.f9.com |
Yes |
No |
No |
|
*BizNet indicates on its website that it provides live reporting but it uses a cloud-based connection into Dynamics GP. It's unclear whether it uses a data warehouse in between. | |||
|
Product |
Direct reporting |
Data warehouse |
Analysis Cube (OLAP) |
|---|---|---|---|
|
BIO – www.bio4analytics.com |
No |
Yes |
Yes |
|
Qbica – www.kootio.com |
No |
Yes |
Yes |
|
OLAP Office – www.olapoffice.com |
No |
Yes |
Yes |
For the purposes of this book, we use the term "data warehouse". Some vendors use the term "data mart". Generally, a data mart is a specific subset of information in a data warehouse. For example, we might have a data warehouse of operational and financial information but we segregate just the vendor and AP information into a data mart for use by the purchasing group. Vendors seem to use them interchangeably with little regard for specific definitions, so for this book, we will use the term data warehouse for both.
The techniques shown in this book work pretty much the same whether you are reporting off a live connection to Dynamics GP, a data warehouse, or a multidimensional cube. Live reporting provides instant gratification. The use of a data warehouse improves the ability to scale reporting without increasing the load on the Dynamics GP server.
Microsoft significantly changed the licensing model for Dynamics GP 2013. In Dynamics GP 2010, for example, accessing GP data via Microsoft Excel required paying for at least a "Light User" license. There was a lot of confusion in the community around what types of activities would require additional licenses to access Dynamics GP data from outside the application. Information from Microsoft was often confusing and contradictory. Users complained that they already had a license to access the data in their SQL server via their SQL Client Access License (CAL).
While staunchly defending their "Light User" license, Microsoft did make a change for Dynamics GP 2013 and has significantly simplified the licensing. Accessing Dynamics GP data from applications such as Excel now only requires an SQL Server CAL.
In this chapter we've looked at a number of ways to get data from Dynamics GP 2013 into Microsoft Excel. Some organizations can be very restrictive when it comes to how accounting information is accessed. Having a lot of options makes it possible to still build an effective dashboard in spite of those restrictions.
In the next chapter, we will look at one of the best, and easiest, options for accessing Microsoft Dynamics GP 2013 data—the included refreshable Excel reports. In that chapter, we will start putting together the data that will eventually go into our dashboard.
