


Mean-Shift Algorithm
The mean-shift algorithm works by assigning each data point a cluster based on the density of the data points in the data space, also known as the mode in a distribution function. Contrary to the k-means algorithm, the mean-shift algorithm does not require you to specify the number of clusters as a parameter.
The algorithm works by modeling the data points as a distribution function, where high-density areas (high concentration of data points) represent high peaks. Then, the general idea is to shift each data point until it reaches its nearest peak, which becomes a cluster.
Understanding the Algorithm
The first step of the mean-shift algorithm is to represent the data points as a density distribution. To do so, the algorithm builds upon the idea of Kernel Density Estimation (KDE), which is a method that's used to estimate the distribution of a set of data:
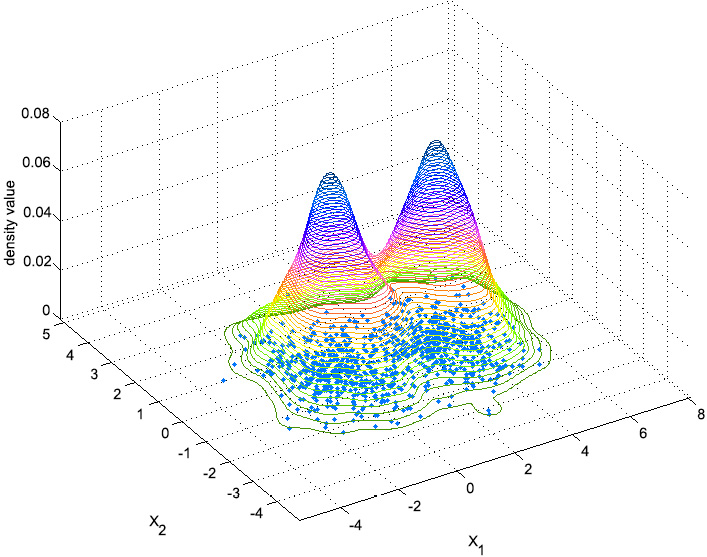
Figure 2.9: An image depicting the idea behind Kernel Density Estimation
In the preceding diagram, the dots at the bottom of the shape represent the data points that the user inputs, while the cone-shaped lines represent the estimated distribution of the data points. The peaks (high-density areas) will be the clusters. The process of assigning data points to each cluster is as follows:
- A window of a specified size (bandwidth) is drawn around each data point.
- The mean of the data inside the window is computed.
- The center of the window is shifted to the mean.
Steps 2 and 3 are repeated until the data point reaches a peak, which will determine the cluster that it belongs to.
The bandwidth value should be coherent with the distribution of the data points in the dataset. For example, for a dataset normalized between 0 and 1, the bandwidth value should be within that range, while for a dataset with all values between 1,000 and 2,000, it would make more sense to have a bandwidth between 100 and 500.
In the following diagram, the estimated distribution is represented by the lines, while the data points are the dots. In each of the boxes, the data points shift to the nearest peak. All the data points in a certain peak belong to that cluster:
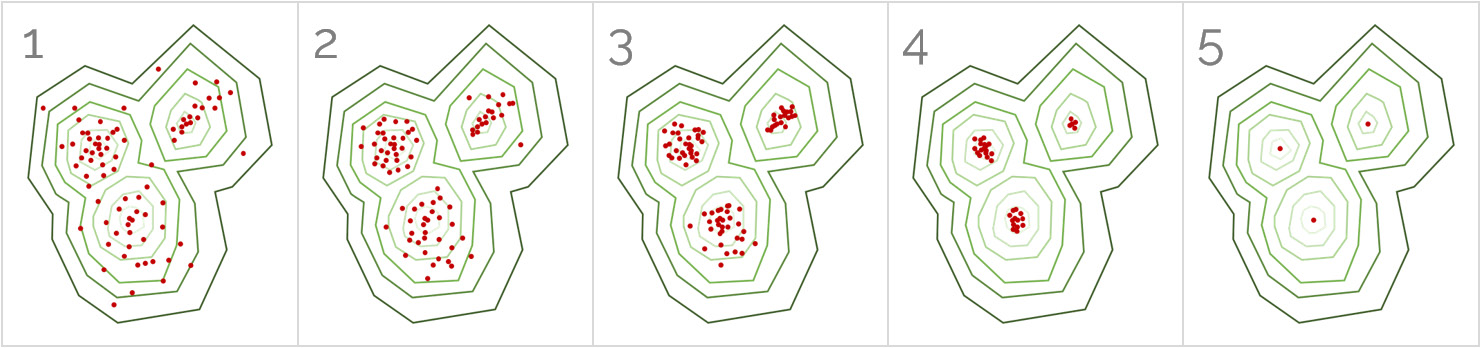
Figure 2.10: A sequence of images illustrating the working of the mean-shift algorithm
The number of shifts that a data point has to make to reach a peak depends on its bandwidth (the size of the window) and its distance from the peak.
Note
To explore all the parameters of the mean-shift algorithm in scikit-learn, visit http://scikit-learn.org/stable/modules/generated/sklearn.cluster.MeanShift.html.
Exercise 2.03: Importing and Training the Mean-Shift Algorithm over a Dataset
The following exercise will be performed using the same dataset that we loaded in Exercise 2.01, Plotting a Histogram of One Feature from the Circles Dataset. Considering this, use the same Jupyter Notebook that you used to develop the previous exercises. Perform the following steps to complete this exercise:
- Open the Jupyter Notebook that you used for the previous exercise.
- Import the k-means algorithm class from scikit-learn as follows:
from sklearn.cluster import MeanShift
- Train the model with a bandwidth of
0.5:est_meanshift = MeanShift(0.5) est_meanshift.fit(data) pred_meanshift = est_meanshift.predict(data)
First, the model is instantiated with a bandwidth of
0.5. Next, the model is fit to the data. Finally, the model is used to assign a cluster to each data point.Considering that the dataset contains values ranging from −1 to 1, the bandwidth value should not be above 1. The value of
0.5was chosen after trying out other values, such as 0.1 and 0.9.Note
Take into account the fact that the bandwidth is a parameter of the algorithm and that, as a parameter, it can be fine-tuned to arrive at the best performance. This fine-tuning process will be covered in Chapter 3, Supervised Learning – Key Steps.
- Plot the results from clustering the data points into clusters:
plt.scatter(data.iloc[:,0], data.iloc[:,1], c=pred_meanshift)
plt.show()
The output is as follows:
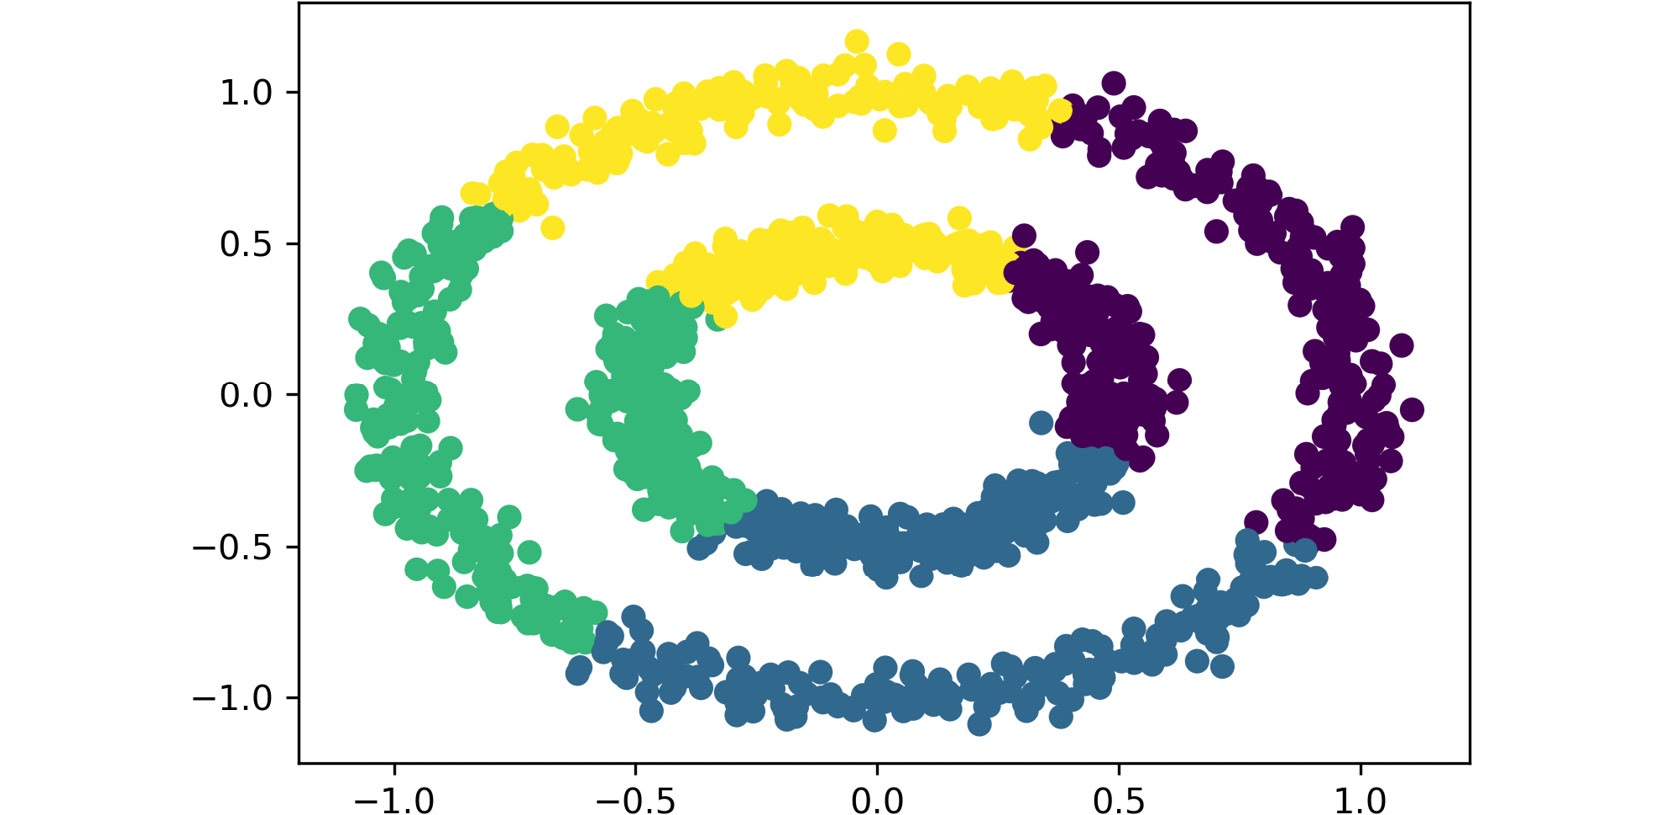
Figure 2.11: The plot obtained using the preceding code
Again, as the dataset only contains two features, both are passed as inputs to the scatter function, which become the values of the axes. Also, the labels that were obtained from the clustering process are used as the colors to display the data points.
The total number of clusters that have been created is four.
Note
To access the source code for this exercise, please refer to https://packt.live/37vBOOk.
You can also run this example online at https://packt.live/3e6uqM2. You must execute the entire Notebook in order to get the desired result.
You have successfully imported and trained the mean-shift algorithm.
In conclusion, the mean-shift algorithm starts by drawing the distribution function that represents the set of data points. This process consists of creating peaks in high-density areas, while leaving the areas with a low density flat.
Following this, the algorithm proceeds to classify the data points into clusters by shifting each point slowly and iteratively until it reaches a peak, which becomes its cluster.
Activity 2.03: Applying the Mean-Shift Algorithm to a Dataset
In this activity, you will apply the mean-shift algorithm to the dataset to see which algorithm fits the data better. Therefore, using the previously loaded Wholesale Consumers dataset, apply the mean-shift algorithm to the data and classify the data into clusters. Perform the following steps to complete this activity:
- Open the Jupyter Notebook that you used for the previous activity.
Note
Considering that you are using the same Jupyter Notebook, be careful not to overwrite any previous variables.
- Train the model and assign a cluster to each data point in your dataset. Plot the results.
The visualization of clusters will differ based on the bandwidth and the features that have been chosen to be plotted.
Note
The solution for this activity can be found via this link.