


The growing demand for data is a key challenge. Decision support teams such as institutional research and business intelligence often cannot take the right decisions on how to expand their business and research outcomes from a huge collection of data. Although data plays an important role in driving the decision, however, in reality, taking the right decision at right time is the goal.
In other words, the goal is the decision support, not the data support. This can be achieved through an advanced use of data management and analytics.
The following diagram in figure 1 (source: H. Gilbert Miller and Peter Mork, From Data to Decisions: A Value Chain for Big Data, Proc. Of IT Professional, Volume: 15, Issue: 1, Jan.-Feb. 2013, DOI: 10.1109/MITP.2013.11) shows the data chain towards taking actual decisions–that is, the goal. The value chains start through the data discovery stage consisting of several steps such as data collection and annotating data preparation, and then organizing them in a logical order having the desired flow. Then comes the data integration for establishing a common data representation of the data. Since the target is to take the right decision, for future reference having the appropriate provenance of the data–that is, where it comes from, is important:
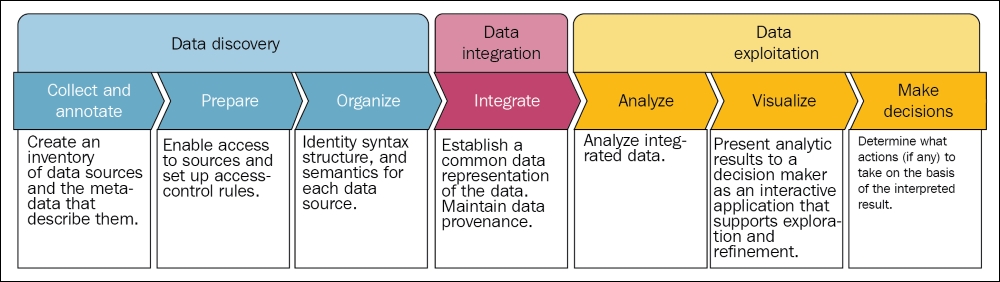
Figure 1: From data to decisions: a value chain for big data
Well, now your data is somehow integrated into a presentable format, it's time for the data exploration stage, which consists of several steps such as analyzing the integrated data and visualization before taking the actions to take on the basis of the interpreted results.
However, is this enough before taking the right decision? Probably not! The reason is that it lacks enough analytics, which eventually helps to take the decision with an actionable insight. Predictive analytics comes in here to fill the gap between. Now let's see an example of how in the following section.
Here is the challenge, Titanic–Machine Learning from Disaster from Kaggle (https://www.kaggle.com/c/titanic):
"The sinking of the RMS Titanic is one of the most infamous shipwrecks in history. On April 15, 1912, during her maiden voyage, the Titanic sank after colliding with an iceberg, killing 1502 out of 2224 passengers and crew. This sensational tragedy shocked the international community and led to better safety regulations for ships. One of the reasons that the shipwreck led to such loss of life was that there were not enough lifeboats for the passengers and crew. Although there was some element of luck involved in surviving the sinking, some groups of people were more likely to survive than others, such as women, children, and the upper-class. In this challenge, we ask you to complete the analysis of what sorts of people were likely to survive. In particular, we ask you to apply the tools of machine learning to predict which passengers survived the tragedy."
But going into this deeper, we need to know about the data of passengers travelling in the Titanic during the disaster so that we can develop a predictive model that can be used for survival analysis.
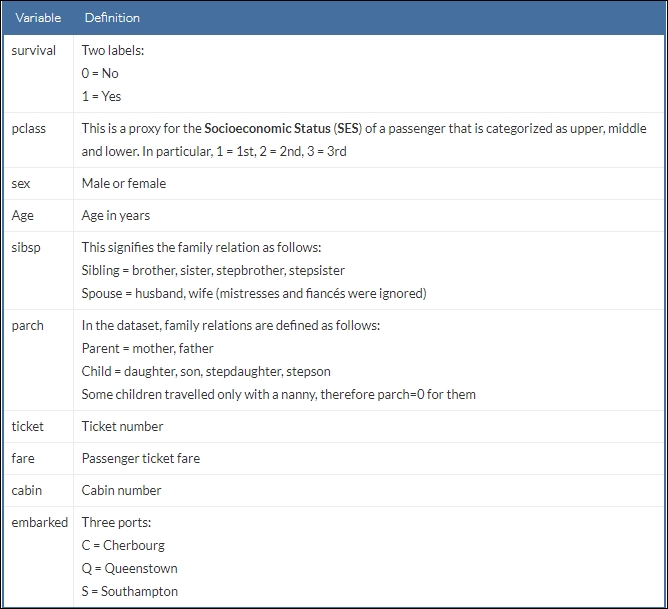
The dataset can be downloaded from the preceding URL. Table 1 here shows the metadata about the Titanic survival dataset:
A snapshot of the dataset can be seen as follows:
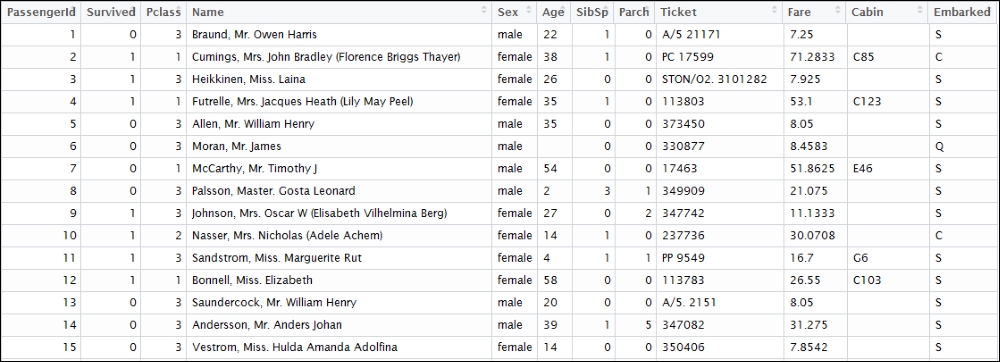
Figure 2: A snapshot of the Titanic survival dataset
The ultimate target of using this dataset is to predict what kind of people survived the Titanic disaster. However, a bit of exploratory analysis of the dataset is a mandate. At first, we need to import necessary packages and libraries:
import pandas as pd
import matplotlib.pyplot as plt
import numpy as np
Now read the dataset and create a panda's DataFrame:
df = pd.read_csv('/home/asif/titanic_data.csv')Before drawing the distribution of the dataset, let's specify the parameters for the graph:
fig = plt.figure(figsize=(18,6), dpi=1600)
alpha=alpha_scatterplot = 0.2
alpha_bar_chart = 0.55
fig = plt.figure()
ax = fig.add_subplot(111)
Draw a bar diagram for showing who survived versus who did not:
ax1 = plt.subplot2grid((2,3),(0,0))
ax1.set_xlim(-1, 2)
df.Survived.value_counts().plot(kind='bar', alpha=alpha_bar_chart)
plt.title("Survival distribution: 1 = survived")
Plot a graph showing survival by Age:
plt.subplot2grid((2,3),(0,1))
plt.scatter(df.Survived, df.Age, alpha=alpha_scatterplot)
plt.ylabel("Age")
plt.grid(b=True, which='major', axis='y')
plt.title("Survival by Age: 1 = survived")
Plot a graph showing distribution of the passengers classes:
ax3 = plt.subplot2grid((2,3),(0,2))
df.Pclass.value_counts().plot(kind="barh", alpha=alpha_bar_chart)
ax3.set_ylim(-1, len(df.Pclass.value_counts()))
plt.title("Class dist. of the passengers")
Plot a kernel density estimate of the subset of the 1st class passengers' age:
plt.subplot2grid((2,3),(1,0), colspan=2)
df.Age[df.Pclass == 1].plot(kind='kde')
df.Age[df.Pclass == 2].plot(kind='kde')
df.Age[df.Pclass == 3].plot(kind='kde')
plt.xlabel("Age")
plt.title("Age dist. within class")
plt.legend(('1st Class', '2nd Class','3rd Class'),loc='best')
Plot a graph showing passengers per boarding location:
ax5 = plt.subplot2grid((2,3),(1,2))
df.Embarked.value_counts().plot(kind='bar', alpha=alpha_bar_chart)
ax5.set_xlim(-1, len(df.Embarked.value_counts()))
plt.title("Passengers per boarding location")
Finally, we show all the subplots together:
plt.show()
>>>
The figure shows the survival distribution, survival by age, age distribution, and the passengers per boarding location:
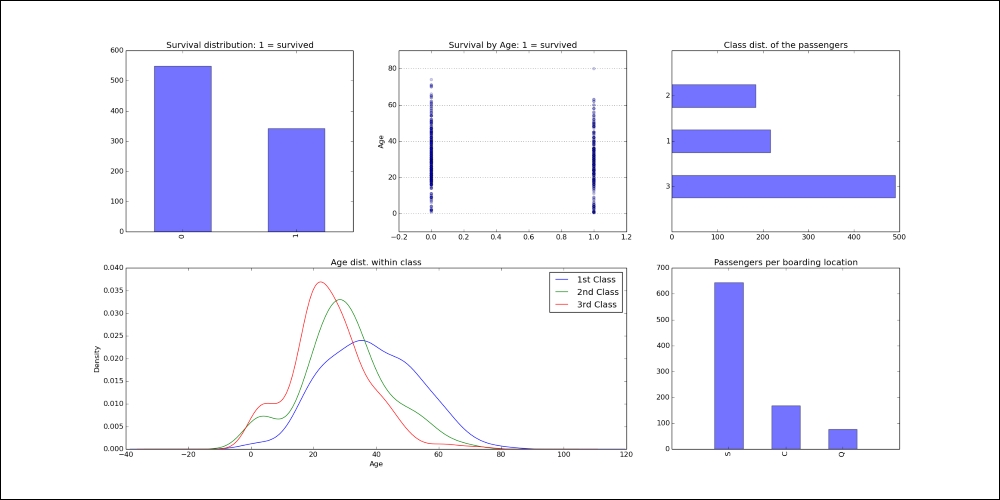
Figure 3: Titanic survival data distribution across age, class, and age within classes and boarding location
However, to execute the preceding code, you need to install several packages such as matplotlib, pandas, and scipy. They are listed as follows:
Installing pandas: Pandas is a Python package for data manipulation. It can be installed as follows:
$ sudo pip3 install pandas
#For Python 2.7, use the following:
$ sudo pip install pandas
Installing matplotlib: In the preceding code, matplotlib is a plotting library for mathematical objects. It can be installed as follows:
$ sudo apt-get install python-matplotlib   # for Python 2.7
$ sudo apt-get install python3-matplotlib # for Python 3.x
Installing scipy: Scipy is a Python package for scientific computing. Installing
blasandlapackandgfortranare a prerequisite for this one. Now just execute the following command on your terminal:$ sudo apt-get install libblas-dev liblapack-dev $ sudo apt-get install gfortran $ sudo pip3 install scipy # for Python 3.x $ sudo pip install scipy # for Python 2.7
For Mac, use the following command to install the above modules:
$ sudo easy_install pip
$ sudo pip install matplotlib
$ sudo pip install libblas-dev liblapack-dev
$ sudo pip install gfortran
$ sudo pip install scipy
For windows, I am assuming that Python 2.7 is already installed at C:\Python27. Then open the command prompt and type the following command:
C:\Users\admin-karim>cd C:/Python27
C:\Python27> python -m pip install <package_name> # provide package name accordingly.
For Python3, issue the following commands:
C:\Users\admin-karim>cd C:\Users\admin-karim\AppData\Local\Programs\Python\Python35\Scripts
C:\Users\admin-karim\AppData\Local\Programs\Python\Python35\Scripts>python3 -m pip install <package_name>
Well, we have seen the data. Now it's your turn to do some analytics on top of the data. Say predicting what kinds of people survived from that disaster. Don't you agree that we have enough information about the passengers, but how could we do the predictive modeling so that we can draw some fairly straightforward conclusions from this data?
For example, say being a woman, being in 1st class, and being a child were all factors that could boost passenger chances of survival during this disaster.
In a brute-force approach–for example, using if/else statements with some sort of weighted scoring system, you could write a program to predict whether a given passenger would survive the disaster. However, does writing such a program in Python make much sense? Naturally, it would be very tedious to write, difficult to generalize, and would require extensive fine tuning for each variable and samples (that is, passenger).
This is where predictive analytics with machine learning algorithms and emerging tools comes in so that you could build a program that learns from the sample data to predict whether a given passenger would survive. In such cases, we will see throughout this book that TensorFlow could be a perfect solution to achieve outstanding accuracies across your predictive models. We will start describing the general overview of the TensorFlow framework. Then we will show how to install and configure TensorFlow on Linux, Mac OS and Windows.