


Exploring the impact of row and column reductions on aggregations
Now you know how to reduce the number of rows and specify the columns that you need in your result set, let’s talk about what the impact will be on any aggregations that you may be interested in.
First of all, based on this result set, you can view the number of backorders by any combination of columns. For example, to see the number of backorders based on year and month, you could use the following query:
SELECT Year([Order Date Key]) as "Order Year",
       Month([Order Date Key]) as "Order Month",
  COUNT([WWI Backorder ID]) as "Number of backorders",
  COUNT(distinct [Customer Key]) as "Impacted Customers",
  COUNT([Order Key]) as "Number of orders"
FROM [WideWorldImportersDW].[Fact].[Order]
WHERE [WWI Backorder ID] IS NOT NULL
GROUP BY Year([Order Date Key]),
         Month([Order Date Key])
ORDER BY Year([Order Date Key]),
         Month([Order Date Key]);
You could also run the following query using the view that you created, and you will get the same results:
SELECT [Order Year],
       [Order Month],
   COUNT([WWI Backorder]) as "number of backorders",
   COUNT([customer]) as "number of impacted customers",
   COUNT([Order]) as "number of orders"
FROM v_backorders
GROUP BY [Order Year],
     [Order Month];
Figure 1.6 shows a subset of the results from the query:
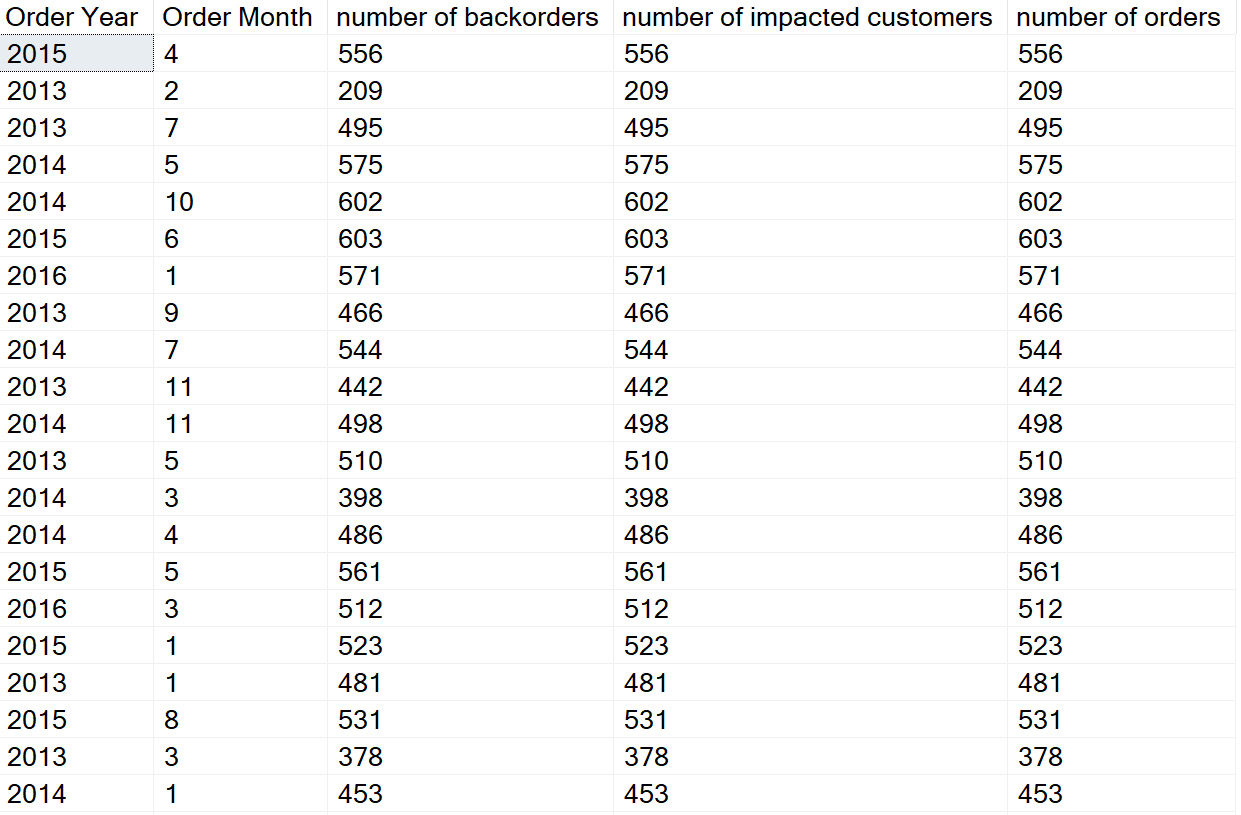
Figure 1.6 – Subset of results from the earlier queries
On closer investigation, you will notice that the values in the number of backorders and number of orders columns are the same. Why is this? The answer is in the filter; it only returns records that have an associated backorder, so you will not get the actual number of orders that have been placed, and any calculations will not be accurate. So, to get an accurate number of orders, you will need to get all the orders in the table, not just the orders associated with a backorder. You will also see that the order of the result set is different for the query that uses the view and the query that does not use the view. This is due to the query that uses the view being stored in a memory heap from the view and accessed on demand, whereas the query that does not use the view is stored on the disk in the primary key order of the table.
This is the impact of using a filter; to get around this, you can add a subquery to remove the filter. So here is how you can update your query to get that additional information:
SELECT Year([Order Date Key]) as [Order Year],
       Month([Order Date Key]) as [Order Month],
   COUNT(distinct [Customer Key]) as [Impacted Customers],
   COUNT(distinct [Stock Item Key]) as [Backorder Items],
   COUNT([WWI Backorder ID]) as [Number of backorders],
   fo.orders,
       fo.Customers
FROM [WideWorldImportersDW].[Fact].[Order] o,
     (select  Year([Order Date Key]) as [Order Year],
              Month([Order Date Key]) as [Order Month],
              COUNT (distinct [Order Key]) as [orders],
              COUNT (distinct [customer Key]) as [Customers]
      FROM [WideWorldImportersDW].[Fact].[Order]
  GROUP BY Year([Order Date Key]),
               Month([Order Date Key])) as fo
WHERE [WWI Backorder ID] IS NOT NULL
AND year(o.[Order Date Key]) = fo.[Order Year]
AND month(o.[Order Date Key]) = fo.[Order Month]
GROUP BY Year([Order Date Key]),
         Month([Order Date Key]),
    fo.orders,
    fo.Customers
ORDER BY Year([Order Date Key]),
         Month([Order Date Key]);
This will give you the following result set, as seen in Figure 1.7. Notice you now see values in the orders, Impacted Customers, Number of backorders, and Customers columns for each Order Month:
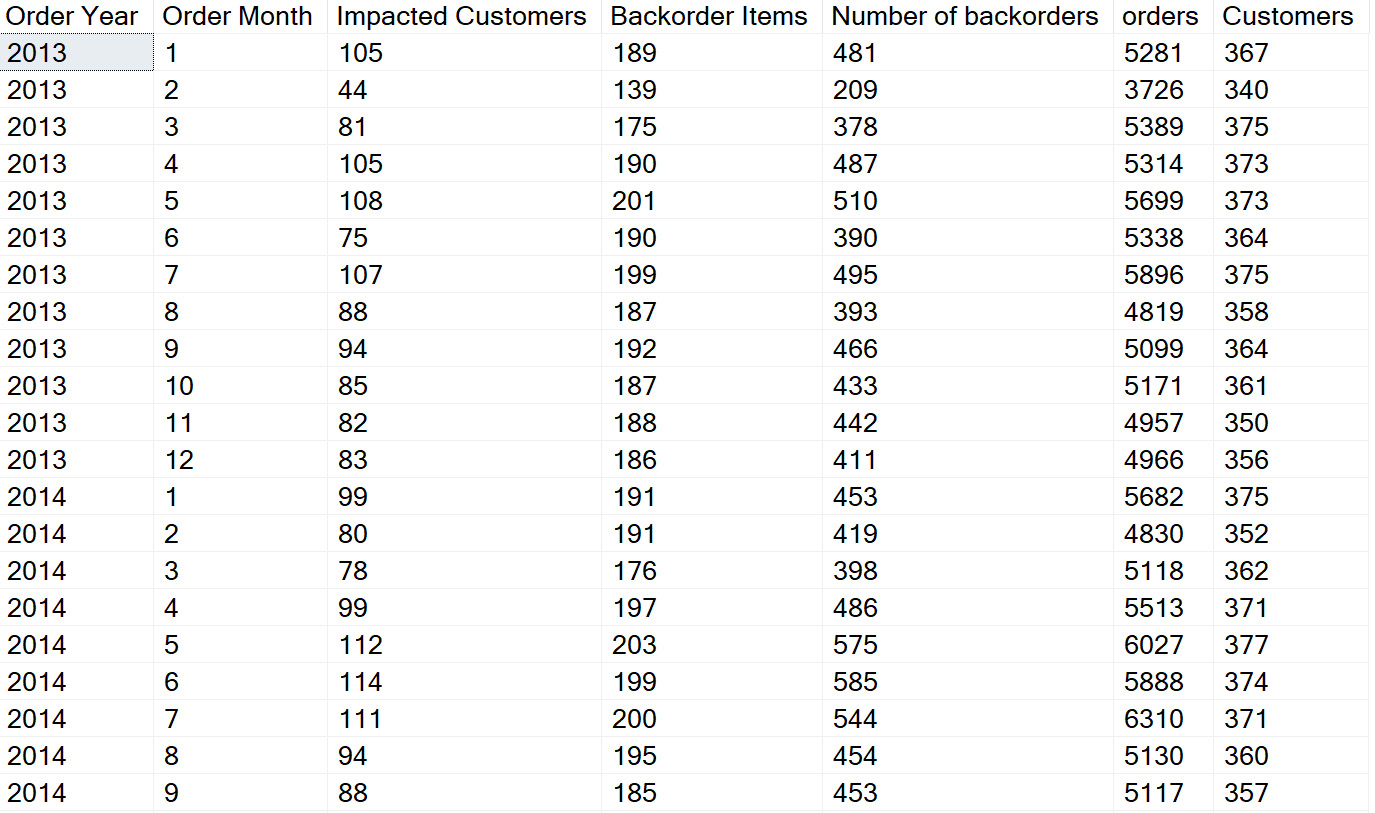
Figure 1.7 – Results of using filters in a query
This can be done for any number of columns as long as the subquery is grouped by the same fields as the main query. To simplify this query, you could very easily create a view of all the orders and then use the views to get the same results with less query development.
Here is a sample of the query to create the order view that you can use in future queries:
CREATE VIEW [dbo].[v_orders] AS
SELECT Year([Order Date Key]) as [Order Year],
      MONTH([Order Date Key]) as [Order Month],
      COUNT(distinct [Order Key]) as [orders],
      COUNT(distinct [customer Key]) as [Customers]
FROM [WideWorldImportersDW].[Fact].[Order]
GROUP BY Year([Order Date Key]),
         Month([Order Date Key])
Here is a sample of the query that uses the two views (v_Backorders and v_orders) that have been created in this chapter:
  SELECT o.[Order Year],
         o.[Order Month],
         o.Customers,
         o.orders,
     COUNT(b.[WWI Backorder]) as [total backorders],
     COUNT(distinct b.[customer]) as [impacted customers]
  FROM [WideWorldImportersDW].[dbo].[v_Backorders] b,
  [WideWorldImportersDW].[dbo].[v_orders] o
  WHERE b.[Order Year] = o.[Order Year]
  AND b.[Order Month] = o.[Order Month]
  GROUP BY o.[Order Year],
           o.[Order Month],
  o.Customers,
  o.orders
  ORDER BY o.[Order Year],
           o.[Order Month];
The following is the result of the query:
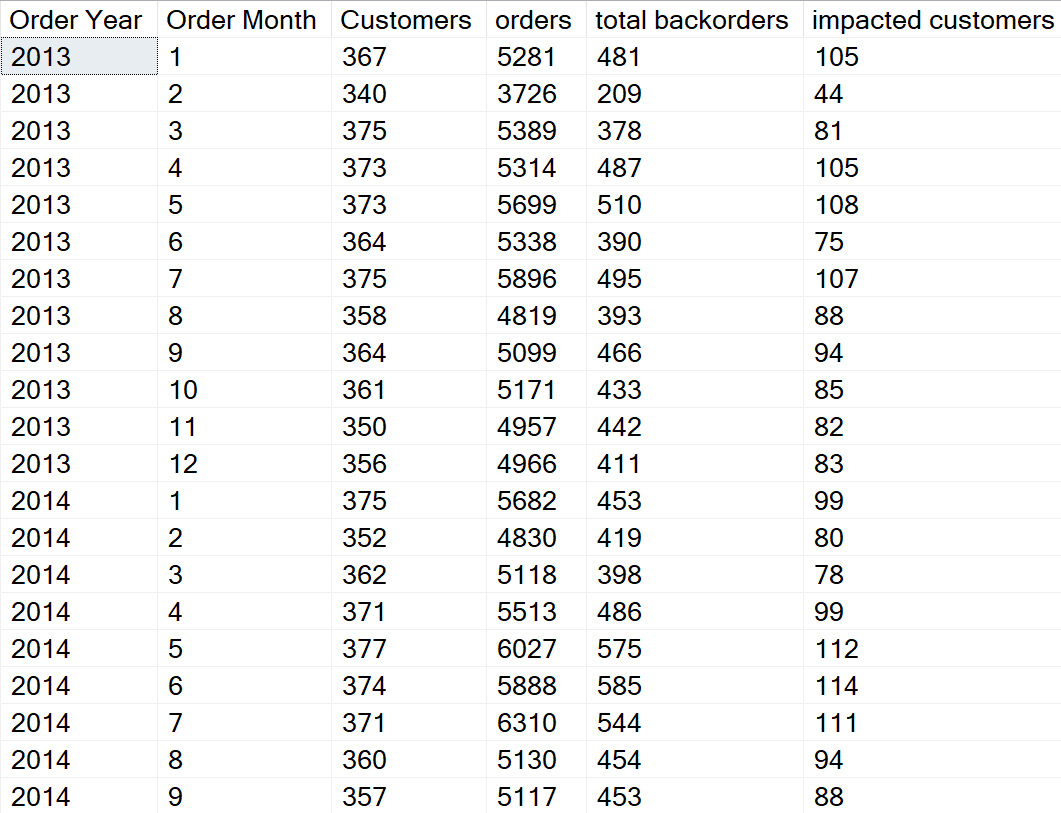
Figure 1.8 – Sample results of using multiple views in a query
So as you can see, it is easy to reduce the amount of data that you bring into your result, but sometimes, you will need to include other data that may have been filtered out. This is where views come in handy and allow you to include data that may have been filtered in previous activities. You will need to use caution when deciding between using a view over a subquery due to the performance implications. In this example, the data size is small enough that the performance implications are negligible.
As you can see from this section, there are multiple ways in which you will be able to create result sets and get the same results.