Search icon
Arrow left icon
All Products
Best Sellers
New Releases
Books
Videos
Audiobooks
Learning Hub
Newsletters
Free Learning
Arrow right icon
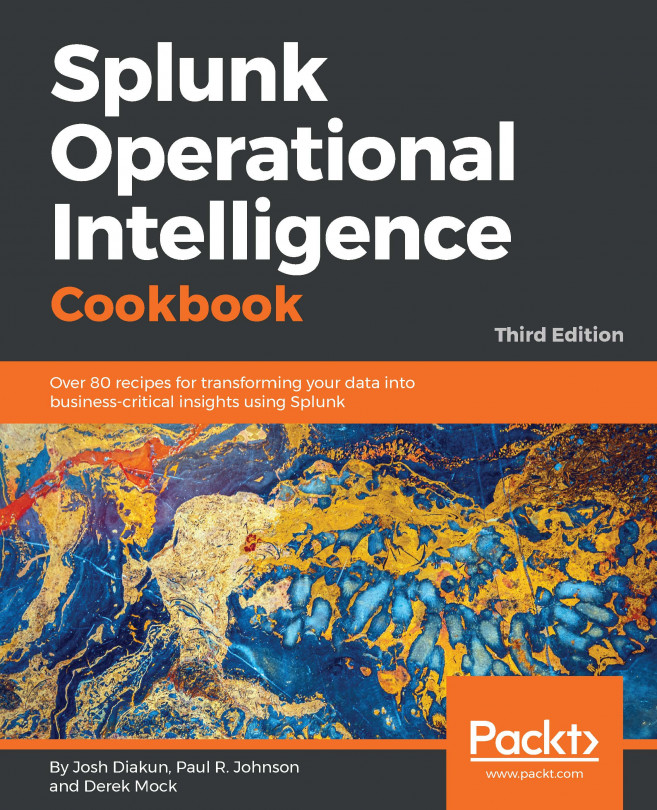
Splunk Operational Intelligence Cookbook. - Third Edition

You're reading from  Splunk Operational Intelligence Cookbook. - Third Edition

Product type Book
Published in May 2018
Publisher
ISBN-13 9781788835237
Pages 541 pages
Edition 3rd Edition
Languages
Authors (4):
Yogesh Raheja Yogesh Raheja
Profile icon Yogesh Raheja
Josh Diakun Josh Diakun
Profile icon Josh Diakun
Paul R. Johnson Paul R. Johnson
Profile icon Paul R. Johnson
Derek Mock Derek Mock
Profile icon Derek Mock
View More author details

Table of Contents (12) Chapters

Preface Play Time – Getting Data In Diving into Data – Search and Report Dashboards and Visualizations - Make Data Shine Building an Operational Intelligence Application Extending Intelligence – Datasets, Modeling and Pivoting Diving Deeper – Advanced Searching, Machine Learning and Predictive Analytics Enriching Data – Lookups and Workflows Being Proactive – Creating Alerts Speeding Up Intelligence – Data Summarization Above and Beyond – Customization, Web Framework, HTTP Event Collector, REST API, and SDKs Other Books You May Enjoy

Diving into Data – Search and Report

In this chapter, we will cover the basic ways to search data in Splunk. We will cover the following recipes:

  • Making raw event data readable
  • Finding the most accessed web pages
  • Finding the most used web browsers
  • Identifying the top-referring websites
  • Charting web page response codes
  • Displaying web page response time statistics
  • Listing the top-viewed products
  • Charting the application's functional performance
  • Charting the application's memory usage
  • Counting the total number of database connections

Introduction

In the previous chapter, we learned about the various ways to get data into Splunk. In this chapter, we will dive right into the data and get our hands dirty.

The ability to search machine data is one of Splunk's core functions, and it should come as no surprise that many other features and functions of Splunk are heavily driven by searches. Everything from basic reports and dashboards through to data models and fully featured Splunk applications is powered by Splunk searches behind the scenes.

The Search Processing Language

Splunk has its own search language known as the Search Processing Language (SPL). This SPL contains hundreds of search commands, most of which also have several functions, arguments...

Making raw event data readable

When a basic search is executed in Splunk from the search bar, the search results are displayed in a raw event format by default. To many users, this raw event information is not particularly readable, and valuable information is often clouded by other less valuable data within the event. Additionally, if events span several lines, only a few events can be seen on screen at any one time.

In this recipe, we will write a Splunk search to demonstrate how we can leverage Splunk commands to make raw event data readable, tabulating events and displaying only the fields we are interested in.

Getting ready

To step through this recipe, you will need a running Splunk Enterprise server, with the sample...

Finding the most accessed web pages

One of the data samples we loaded in Chapter 1, Play Time - Getting Data In, contained access logs from our web server. These have a Splunk source type of access_combined and detail all pages accessed by users of our web application. We are particularly interested in knowing which pages are being accessed the most, as this information provides great insight into how our e-commerce web application is being used. It could also help influence changes to our web application such that rarely visited pages are removed, or our application is redesigned to be more efficient.

In this recipe, we will write a Splunk search to find the most accessed web pages over a given period of time.

Getting ready

...

Finding the most used web browsers

Users visiting our website use a variety of devices and web browsers. By analyzing the web access logs, we can understand which browsers are the most popular and therefore which browsers our site must support at the least. We can also use this same information to help identify the types of devices that people are using.

In this recipe, we will write a Splunk search to find the most used web browsers over a given period of time. We will then make use of both the eval and replace commands to clean up the data a bit.

Getting ready

To step through this recipe, you will need a running Splunk Enterprise server with the sample data loaded from Chapter 1, Play Time - Getting Data In. You should be...

Identifying the top-referring websites

Our web access logs continue to give us great information about our website and the users visiting the site. Understanding where our users are coming from provides insight into potential sales leads and/or which marketing activities might be working better than others. For this information, we look for the referer_domain field value within the log data.

In this recipe, we will write a Splunk search to find the top-referring websites.

Getting ready

To step through this recipe, you will need a running Splunk Enterprise server, with the sample data loaded from Chapter 1, Play Time – Getting Data In. You should be familiar with the Splunk search bar and the time range picker.

...

Charting web page response codes

Log data often contains seemingly cryptic codes that have all sorts of meanings. This is true of our web access logs, where there is a status code that represents a web page response. This code is very useful, as it can tell us whether certain events were successful or not. For example, error codes found in purchase events are less than ideal, and if our website was at fault, then we might have lost a sale.

In this recipe, we will write a Splunk search to chart web page responses against the various web pages on the site.

Getting ready

To step through this recipe, you will need a running Splunk Enterprise server, with the sample data loaded from Chapter 1, Play Time - Getting Data In. You should...

Displaying web page response time statistics

No one likes to wait for a web page to load, and we certainly do not want users of our web application waiting either! Within our web access logs, there is a field named response that tracks the total time the page has taken to load in milliseconds.

In this recipe, we will track the average page load time over the past week at different times of the day.

Getting ready

To step through this recipe, you will need a running Splunk Enterprise server, with the sample data loaded from Chapter 1, Play Time – Getting Data In. You should be familiar with the Splunk search bar and the time range picker.

...

Listing the top-viewed products

Our web access logs capture the product IDs (the item field in the logs) that users are viewing and adding to their shopping carts most often. Understanding the top products that people view can help influence our sales and marketing strategy, and even product direction. Additionally, products viewed on an e-commerce website might not always necessarily translate into sales of that product.

In this next recipe, we will write a Splunk search to chart the 10 ten products that users successfully view and compare against the number of successful shopping cart additions for each product. For example, if a product has a high number of views but is not being added to carts and is subsequently purchased, this could indicate that something is not right; perhaps the pricing of the product is too high.

...

Charting the application's functional performance

Another of the data samples we loaded in Chapter 1, Play Time - Getting Data In, contained application logs from our application server. These have a Splunk source type of log4j and detail the various calls that our application makes to the backend database in response to user web requests, in addition to providing insight into memory utilization and other health-related information. We are particularly interested in tracking how our application is performing in relation to the time taken to process user-driven requests for information.

In this recipe, we will write a Splunk search to find out how our application is performing. To do this, we will analyze database call transactions and chart the maximum, mean, and minimum transaction durations over the past week.

...

Charting the application's memory usage

In addition to measuring the functional performance of database transactions, we are also interested in understanding how our application is performing from a memory usage perspective. Analyzing this type of information can help identify memory leaks in our application or high memory utilization that might be affecting the user experience and causing our application to slow down.

In this recipe, we will analyze the memory usage of our application over time.

Getting ready

To step through this recipe, you will need a running Splunk Enterprise server, with the sample data loaded from Chapter 1, Play Time – Getting Data In. You should be familiar with the Splunk search bar and...

Counting the total number of database connections

Our application currently only allows for a limited number of concurrent database connections. As our application user base grows, we need to monitor these connections proactively to ensure that we do not hit our concurrency limit and we know when we need to scale out the database infrastructure further.

In the last recipe of this chapter, we will monitor database transactions over the past week to identify if there are certain times or days when we might be close to our concurrency limit.

Getting ready

To step through this recipe, you will need a running Splunk Enterprise server, with the sample data loaded from Chapter 1, Play Time - Getting Data In. You should be familiar...

lock icon The rest of the chapter is locked
You have been reading a chapter from
Splunk Operational Intelligence Cookbook. - Third Edition
Published in: May 2018 Publisher: ISBN-13: 9781788835237
Register for a free Packt account to unlock a world of extra content!
A free Packt account unlocks extra newsletters, articles, discounted offers, and much more. Start advancing your knowledge today.
Unlock this book and the full library FREE for 7 days
Get unlimited access to 7000+ expert-authored eBooks and videos courses covering every tech area you can think of
Renews at $15.99/month. Cancel anytime}