Reader small image

You're reading from  Splunk Essentials - Second Edition

Product typeBook
Published inSep 2016
Publisher
ISBN-139781785889462
Edition2nd Edition
Tools
Right arrow
Authors (3):
Betsy Page Sigman
Betsy Page Sigman
author image
Betsy Page Sigman

Betsy Page Sigman is a distinguished professor at the McDonough School of Business at Georgetown University in Washington, D.C. She has taught courses in statistics, project management, databases, and electronic commerce for the last 16 years, and has been recognized with awards for teaching and service. She has also worked at George Mason University in the past. Her recent publications include a Harvard Business case study and a Harvard Business review article. Additionally, she is a frequent media commentator on technological issues and big data.
Read more about Betsy Page Sigman

Somesh Soni
Somesh Soni
author image
Somesh Soni

Somesh Soni is a Splunk Consultant with over 11 years of IT experience. He has bachelor degree in Computer Science (Hons.) and has been a interested in exploring and learning new technologies throughout his whole life. He has extensive experience in Consulting, Architecture, Administration and Development in Splunk. He's proficient in various programming languages and tools including C#.NET/VB.NET, SSIS, and SQL Server etc. Somesh is currently working as a Splunk Master with Randstad Technologies. His activities are focused on Consulting, Implementation, Admin, Architecture and support related activities for Splunk. He started his career with the one of the Top 3 Indian IT giant He has executed projects for major fortune 500 companies like Coca-Cola, Wells Fargo, Microsoft, Capital Group etc. He has performed in various capacities of Technical Architect, Technical Lead, Onsite Coordinator, Technology Analyst etc. Somesh has been a great contributor in the Splunk Community work and has consistently been on the top of the list. He is a member of Splunk Trust 2015-16 and overall one of the topmost contributor to Splunk Answers community. Acknowledgement: I would like to thank my family and colleagues who have always encouraged and supported me to follow my dreams, my friends who put up with all my crazy antics while I went on a Splunk exploratory Journey and listened with patience on all the tips and tricks of Splunk which I shared with them. Last but not the least I would like to express my gratitude to the entire team of Packt Publishing Ltd for giving me this opportunity.
Read more about Somesh Soni

Erickson Delgado
Erickson Delgado
author image
Erickson Delgado

Erickson Delgado is an enterprise architect who loves to mine and analyze data. He began using Splunk in version 4.0 and has pioneered the use of the application in his current work. In the earlier parts of his career, he worked with start-up companies in the Philippines to help build their open source infrastructure. He then worked in the cruise industry as a shipboard IT manager, and he loved it. From there, he was recruited to work at the company's headquarters as a software engineer.
Read more about Erickson Delgado

View More author details
Right arrow

Chapter 6. Panes of Glass

Splunk makes it easy to visualize data, and in this chapter we will show how to do that through a pane of glass or what is sometimes called a single pane of glass dashboard. This just means a dashboard that is designed with an effective graphic user interface that is easy to navigate and carefully laid out to be useful. This ability to make dashboards is one of Splunk's most useful features. Most of the charts that you will need to represent your data are already built into the application and you can organize these with very minimal effort. With practice, you can spin off a dashboard in a fraction of the time you might expect it to take.

In this chapter, we will work on the following topics:

  • How to identify the different types of dashboard

  • How to gather business requirements

  • How to modify dashboard panels

  • Building a single pane of glass dashboard with key performance indicators

Creating effective dashboards


It is easy to use Splunk to develop an attractive dashboard with multiple panels. However, this is not usually the best way to present your information. This is because a dashboard with multiple panels generally requires scrolling down the page, which can take the viewer's eyes away from crucial information. An effective dashboard should generally meet the following conditions:

  • Single page: The dashboard fits on a single page with no scrolling required

  • Multiple data points displayed: Charts and visualizations should display a number of data points

  • Crucial information highlighted: The dashboard points out the most important information, using appropriate titles, labels, legends, and markers

  • Created with the user in mind: Data is summarized in a way that is meaningful to the viewer

  • Loads quickly: The dashboard loads in a few seconds

  • Avoid redundancy: The display does not repeat information in multiple places

Types of dashboard


There are three kinds of dashboard that you will typically create with Splunk:

  • Dynamic form-based dashboards

  • Static real-time dashboards

  • Dashboards as scheduled reports

Dynamic form-based dashboards allow Splunk users to change the dashboard data without leaving the page. This is accomplished by adding input fields (such as time, radio (button), textbox, checkbox, dropdown, and so on) in the dashboard, which changes the data based on the current selection. This is an effective type of dashboard for teams that troubleshoot issues and analyze data.

Static real-time dashboards are often kept on a big panel screen for constant viewing, simply because they are so useful. You see these dashboards in data centers or Network Operations Centers (NOCs). Even though they are called static, in fact the data changes in real time without refreshing the page; it is just the format that stays constant. The dashboard will also have indicators and alerts that allow operators to easily identify...

Form inputs


Now that we have the dashboard layout that we want, it is time to make it dynamic and interactive. Before we proceed, let us just highlight some of the basic key concepts related to form inputs.

Just as in any web page, a form input is an element that allows you to select or type in information that will be submitted to the application for processing. There are different form inputs available for Splunk dashboards:

  • Text

  • Radio (which uses a radio button)

  • Dropdown (which uses a dropdown menu or list)

  • Checkbox

  • Multiselect (which allows you to select several responses)

  • Link list (this is a horizontal list that contains clickable links)

  • Time

  • Submit

If you click on Edit | Edit Panels, you will see that you can select which Form Input you require by clicking on the Add Input dropdown.

  1. Go ahead and select Text in the Add Input drop-down. A new editable input field panel will be added at the very top of the dashboard. You can either edit the properties of the field using the pencil icon or delete...

Creating a time range input


Let us change our input field into a time range field.

  1. Click on Add Input.

  2. On the list to the left, select Time.

  3. In the General section, type Select Time Range in the Label space.

  4. Click on the Search on Change checkbox.

  5. Set the Default time range to Last 24 Hours.

  6. Use the following screenshot as a guide.

  7. Click Apply when done:

  8. Before you save the dashboard changes, click the Autorun dashboard checkbox, as seen in the following screenshot:

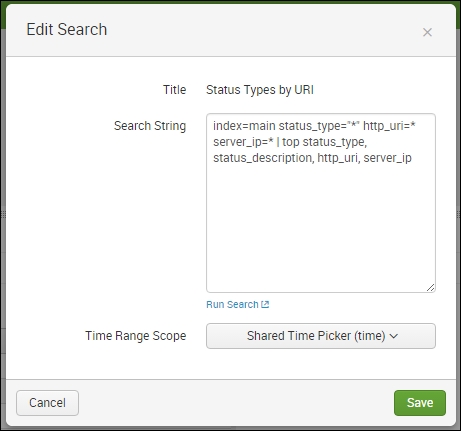
You can now try to change the time range using the time input, but nothing will happen. This is because we have not yet configured the panels to react when the time input has been changed. Let us do that now:

  1. Go back to Edit | Edit Panels mode.

  2. Select Inline Search and edit  Search String on the first panel.

  3. Change Time Range Scope to Shared Time Picker (time).

  4. Click on Save :

Notice that the data on the first panel now reacts to the changes you make on the time range input. Perform the same steps on the other three panels and watch the data...

Creating a radio input


Now we are going to create radio inputs with dynamic search options. This will allow viewers to select server and status types, and will affect the information rendered by the panels:

  1. Click on Edit | Edit Panels.

  2. Select Add Input | Radio.

  3. Click on the Editicon in the newly created input.

  4. In the Labelfield, type in Select Server.

  5. Enable Search on Changeby checking the checkbox.

  6. In the Token field, type server:

  7. Scroll down to Static Optionsand click on it. In Static Options, add Name as ALLand Value as *.

  8. Click Dynamic Options, then fill inSearch String, entering the following search command:

          SPL> index=main | top server_ip
    
  9. Change the time range from All time to Last 60 minutes.

  10. In Field For Label, type in server_ip.

  11. In Field For Value, type in server_ip.

  12. Now scroll back up to Token Options.

  13. For Default, select ALL.

  14. For Initial Value, select ALL.

  15. Click Applyand you're done:

Now that you have configured the radio input with dynamic search options, you will see that the selection...

Creating a dropdown input


Dropdown inputs function exactly the same as radio inputs. The former is used when the selection is huge and you do not want the list of choices to unnecessarily clutter the entire page. The http_uri field has numerous results, so this makes a drop-down the ideal candidate for input here.

Follow the same procedure as for radio input creation, but make sure you have selected Dropdown instead. Use the following information and screenshots as guides to complete the task:

  1. Click on Edit | Edit Panels.

  2. Select Add Input | Dropdown.

  3. Click the Editicon in the newly created input.

  4. In the Labelfield, type in Select HTTP URI to name your new drop-down.

  5. As you did when you created a radio button, enable Search on Changeby checking the checkbox.

  6. In the Token field, type http_uri.

  7. Under Token Options section, in Default, select ALL.

  8. Under Token Options section, in Initial Value, select ALL.

  9. For Static Options, type { Name: ALL, Value: * }.

  10. Under Dynamic Options, be sure the search icon is...

Static Real-Time dashboard


In this section, we will create a real-time dashboard that will display crucial information based on the data we have. To encourage you, we present a screenshot here with how it will look when we are done:

Test real-time dashboard with advanced indicators, combo charts, and choropleth charts

Single Value Panels with color ranges

In the previous sections, you first created panels by running a search then saving them in a dashboard. After you created all your search panels, you then started to modify the visualization from the dashboard. This is one way to achieve it. However, typically you first want to see your visualization before adding it to a dashboard. This makes it a more straightforward approach. We will use that method in upcoming sections:

  1. Let's start with a search command in the Destinations app to create the dashboard:

          SPL> index=main http_uri=/booking/confirmation http_status_code=200 
               | stats count
    
  2. Select Real-Time > 1 hour...

Creating a map called a choropleth


A choropleth, whose name comes from two Greek words meaning area/region and multitude, is a two-dimensional map where areas are designated by color shades or patterns to indicate the measured strength of a statistical indicator, such as sales per area or crime rates.

I'm sure you have already seen a choropleth, even if you didn't know what it was. Maybe you have seen areas of the US map shaded by state during a nationwide election. Or maybe you have seen a map of countries with a range of colors.

We cannot dig into the mathematical details of how a choropleth is created, but are fortunate that we can use Splunk 6.3+ to provide this effective visualization tool for us. We will create two choropleths to denote bookings by region and traffic by region.

Since we don't have a panel to clone from, we will create this from scratch:

  1. Enter edit mode with Edit | Edit Panels.

  2. Click on Add Panel.

  3. Select New | Choropleth Map.

  4. Change Time Range to Real-time and its value as...

Summary


In this chapter, you have delved deeper into dashboard creation. You have learned about the different types of dashboard and when to use them. You have created a fully functional form-based dashboard that allowed you to change the inputs and affect the dashboard data. You have also learned how to use tokens and assign them to search panels, and how to create and modify advanced visualization tools. Finally, you have learned how to create a real-time dashboard with advanced visualization panels such as Single Value Panels with Trends and Choropleths map. In the next chapter, Chapter 7, Splunk SDK for JavaScript and D3.js, you will learn to use the Splunk System Development Kit to make your visualizations even more interesting.

lock icon
The rest of the chapter is locked
You have been reading a chapter from
Splunk Essentials - Second Edition
Published in: Sep 2016Publisher: ISBN-13: 9781785889462
Register for a free Packt account to unlock a world of extra content!
A free Packt account unlocks extra newsletters, articles, discounted offers, and much more. Start advancing your knowledge today.
undefined
Unlock this book and the full library FREE for 7 days
Get unlimited access to 7000+ expert-authored eBooks and videos courses covering every tech area you can think of
Renews at $15.99/month. Cancel anytime

Authors (3)

author image
Betsy Page Sigman

Betsy Page Sigman is a distinguished professor at the McDonough School of Business at Georgetown University in Washington, D.C. She has taught courses in statistics, project management, databases, and electronic commerce for the last 16 years, and has been recognized with awards for teaching and service. She has also worked at George Mason University in the past. Her recent publications include a Harvard Business case study and a Harvard Business review article. Additionally, she is a frequent media commentator on technological issues and big data.
Read more about Betsy Page Sigman

author image
Somesh Soni

Somesh Soni is a Splunk Consultant with over 11 years of IT experience. He has bachelor degree in Computer Science (Hons.) and has been a interested in exploring and learning new technologies throughout his whole life. He has extensive experience in Consulting, Architecture, Administration and Development in Splunk. He's proficient in various programming languages and tools including C#.NET/VB.NET, SSIS, and SQL Server etc. Somesh is currently working as a Splunk Master with Randstad Technologies. His activities are focused on Consulting, Implementation, Admin, Architecture and support related activities for Splunk. He started his career with the one of the Top 3 Indian IT giant He has executed projects for major fortune 500 companies like Coca-Cola, Wells Fargo, Microsoft, Capital Group etc. He has performed in various capacities of Technical Architect, Technical Lead, Onsite Coordinator, Technology Analyst etc. Somesh has been a great contributor in the Splunk Community work and has consistently been on the top of the list. He is a member of Splunk Trust 2015-16 and overall one of the topmost contributor to Splunk Answers community. Acknowledgement: I would like to thank my family and colleagues who have always encouraged and supported me to follow my dreams, my friends who put up with all my crazy antics while I went on a Splunk exploratory Journey and listened with patience on all the tips and tricks of Splunk which I shared with them. Last but not the least I would like to express my gratitude to the entire team of Packt Publishing Ltd for giving me this opportunity.
Read more about Somesh Soni

author image
Erickson Delgado

Erickson Delgado is an enterprise architect who loves to mine and analyze data. He began using Splunk in version 4.0 and has pioneered the use of the application in his current work. In the earlier parts of his career, he worked with start-up companies in the Philippines to help build their open source infrastructure. He then worked in the cruise industry as a shipboard IT manager, and he loved it. From there, he was recruited to work at the company's headquarters as a software engineer.
Read more about Erickson Delgado