


In this recipe we will use the handy pandas data analysis library to view and visualize the iris dataset. It contains the notion o, a dataframe which might be familiar to you if you use the language R's dataframe.
Viewing the iris dataset with Pandas
How to do it...
You can view the iris dataset with Pandas, a library built on top of NumPy:
- Create a dataframe with the observation variables iris.data, and column names columns, as arguments:
import pandas as pd
iris_df = pd.DataFrame(iris.data, columns = iris.feature_names)
The dataframe is more user-friendly than the NumPy array.
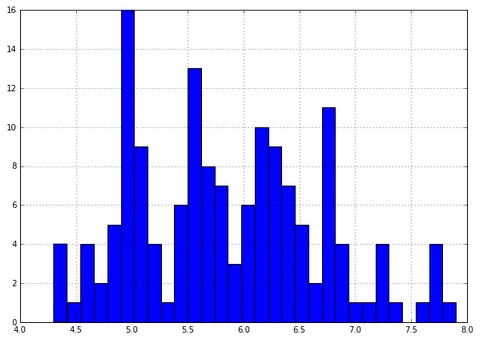
- Look at a quick histogram of the values in the dataframe for sepal length:
iris_df['sepal length (cm)'].hist(bins=30)
- You can also color the histogram by the target variable:
for class_number in np.unique(iris.target):
    plt.figure(1)
    iris_df['sepal length (cm)'].iloc[np.where(iris.target == class_number)[0]].hist(bins=30)
- Here, iterate through the target numbers for each flower and draw a color histogram for each. Consider this line:
np.where(iris.target== class_number)[0]
It finds the NumPy index location for each class of flower:
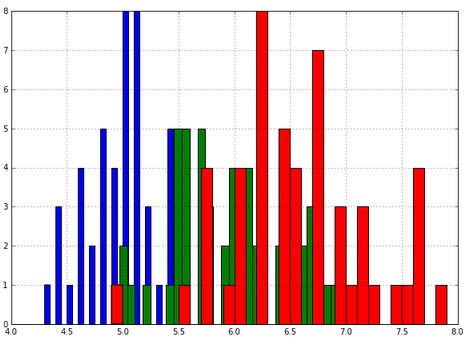
Observe that the histograms overlap. This encourages us to model the three histograms as three normal distributions. This is possible in a machine learning manner if we model the training data only as three normal distributions, not the whole set. Then we use the test set to test the three normal distribution models we just made up. Finally, we test the accuracy of our predictions on the test set.
How it works...
The dataframe data object is a 2D NumPy array with column names and row names. In data science, the fundamental data object looks like a 2D table, possibly because of SQL's long history. NumPy allows for 3D arrays, cubes, 4D arrays, and so on. These also come up often.