


This book is designed to give financial executives and personnel a greater understanding of how to use QlikView for financial insight. The lessons and examples in this book presume that you have already downloaded QlikView and can start it from your program menu. You should also have a working knowledge of Microsoft Excel.
Start QlikView from your Start program menu in Windows. After QlikView starts, you can begin to navigate around in it and start to familiarize yourself with the environment.
QlikView consists of two parts: the sheet contains sheet objects, such as charts or list boxes that show clickable information, and the load script stores information about the data and the data sources that the data is coming from.
Financial professionals always use Excel to examine their data. So, we are going to start by loading data from an Excel sheet using the New document button. QlikView can also help you create a basic document sheet containing a chart. The newest version of QlikView comes with sample Sales Order data that can be used to investigate and create sheet objects.
To use data from other file types, you can use File Wizard: Type that you start from the Edit Script dialog by clicking on the Table Files button.
Using the Edit Script dialog, you can view your data script, edit the script, and add other data sources. You reload your data by clicking on the Reload button. If you just want to analyze data from an existing QlikView file and analyze the information in it, you do not need to work with the script at all.
After QlikView opens, you will see the default start screen:
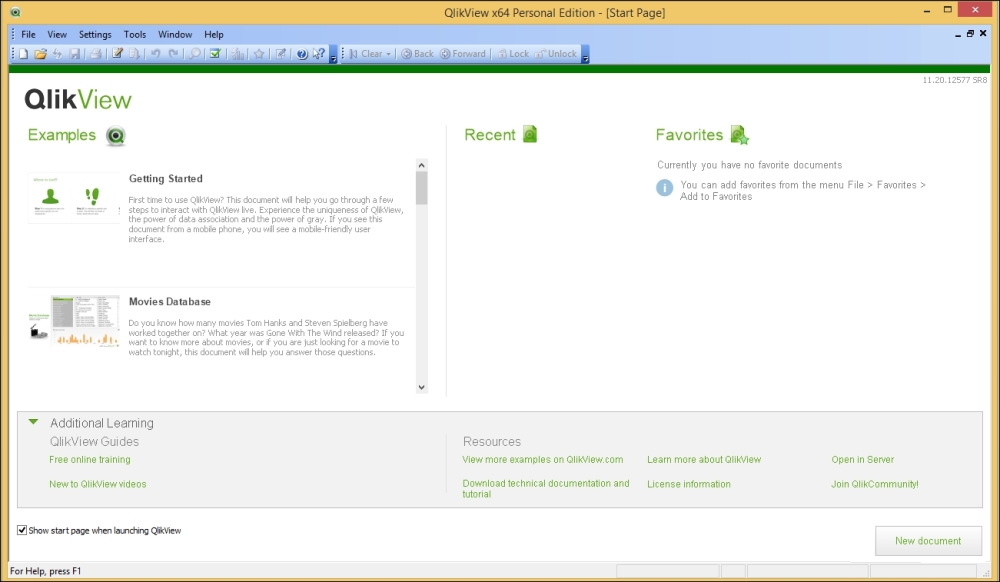
Figure 1-1: The default start screen
Here, you will see the side menu with Getting Started ► as the highlighted selection; along with Recent, which will be blank the first time QlikView is opened; Favorites, which is also empty at this point; Open in Server, which allows you to register the QlikView server if your company has an Enterprise QlikView license and is running QlikView from a server; and Resources, where you can follow links back to the QlikView website and see more examples. In the lower-left corner, you have the option to uncheck the box to show this screen when starting QlikView. Leave that option checked to make it easy to navigate to examples and training.
Getting Started shows that you are running QlikView Personal Edition, with options to use Learn QlikView and to see Examples. The third entry, under Examples in this version, is Data Visualization, which is a very good tutorial on what types of charts to use to aid in visual discovery and understanding of your data relationships.
Now, let's create our first QlikView document by loading data from Excel. Start by clicking on the New Document button located in the lower-right corner of this version of QlikView. Prior editions of the personal download have other options, such as a link under Learn QlikView saying Create a new QlikView document by loading data from an Excel file.
For this example, we will use sample financial data downloaded from an ERP system into Excel. This sample data can be downloaded from your account at Packt Publishing at http://www.PacktPub.com. The filenames are CHData-Oct.xls and CHData-Nov.xls. Review the data in Excel before you load it to learn how a load file should be set up.
There are six steps to setting up the load file:
Select the data source. Do this by clicking on Browse and navigating to the Excel file that you are going to analyze. First, we will load the file named
CHData-Oct.xls.Verify the data and choose to use column headers from this data file (or create your own for each column in the data). With the sample data, we will use the existing column headers.
Save your new QlikView QVW file and give it a name of your choice. Our example uses
CheyenneCO.qvw.Choose the chart type that you wish to create for your first sheet object. Here, because it is one month of financial type data, we will choose a bar chart to start examining our sample data.
Select the dimension(s) that you want to use in your first chart. Here, we selected AcctGroup. We can alternatively choose CostCenter. Dimensions represents the columns of data from the Excel file that we loaded. We will add a mathematical expression, such as sum or average. We will just add the sum expression of the Amount column we loaded.
For our final selections, we will choose a table box that will list and group all our fields.
We have now created our first QlikView application. Move your objects around so that your table box is lower in the screen, and widen it so that all the columns can be seen. Then, in the free space above, right-click and add a statistics box. I have named it Statistics Box in the screenshot. Make sure that you choose Amount as your statistic. If you prefer, you can remove or add statistical measures from your statistics. Your QlikView Financial Analysis of Cheyenne Company should appear similar to the following screenshot:
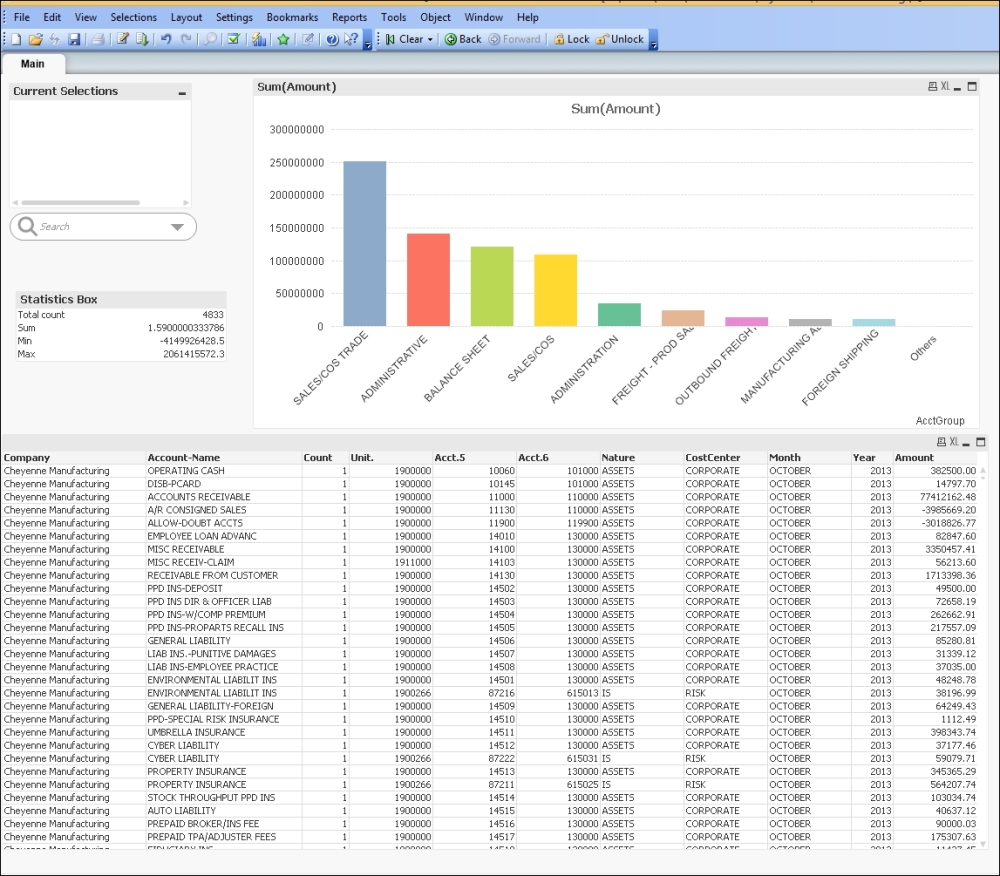
Figure 1-2: Our financial analysis QlikView application


