Search icon
Arrow left icon
All Products
Best Sellers
New Releases
Books
Videos
Audiobooks
Learning Hub
Newsletters
Free Learning
Arrow right icon
Python for Finance Cookbook

You're reading from  Python for Finance Cookbook

Product type Book
Published in Jan 2020
Publisher Packt
ISBN-13 9781789618518
Pages 432 pages
Edition 1st Edition
Languages
Author (1):
Eryk Lewinson Eryk Lewinson
Profile icon Eryk Lewinson

Table of Contents (12) Chapters

Preface Financial Data and Preprocessing Technical Analysis in Python Time Series Modeling Multi-Factor Models Modeling Volatility with GARCH Class Models Monte Carlo Simulations in Finance Asset Allocation in Python Identifying Credit Default with Machine Learning Advanced Machine Learning Models in Finance Deep Learning in Finance Other Books You May Enjoy

Calculating the relative strength index and testing a long/short strategy

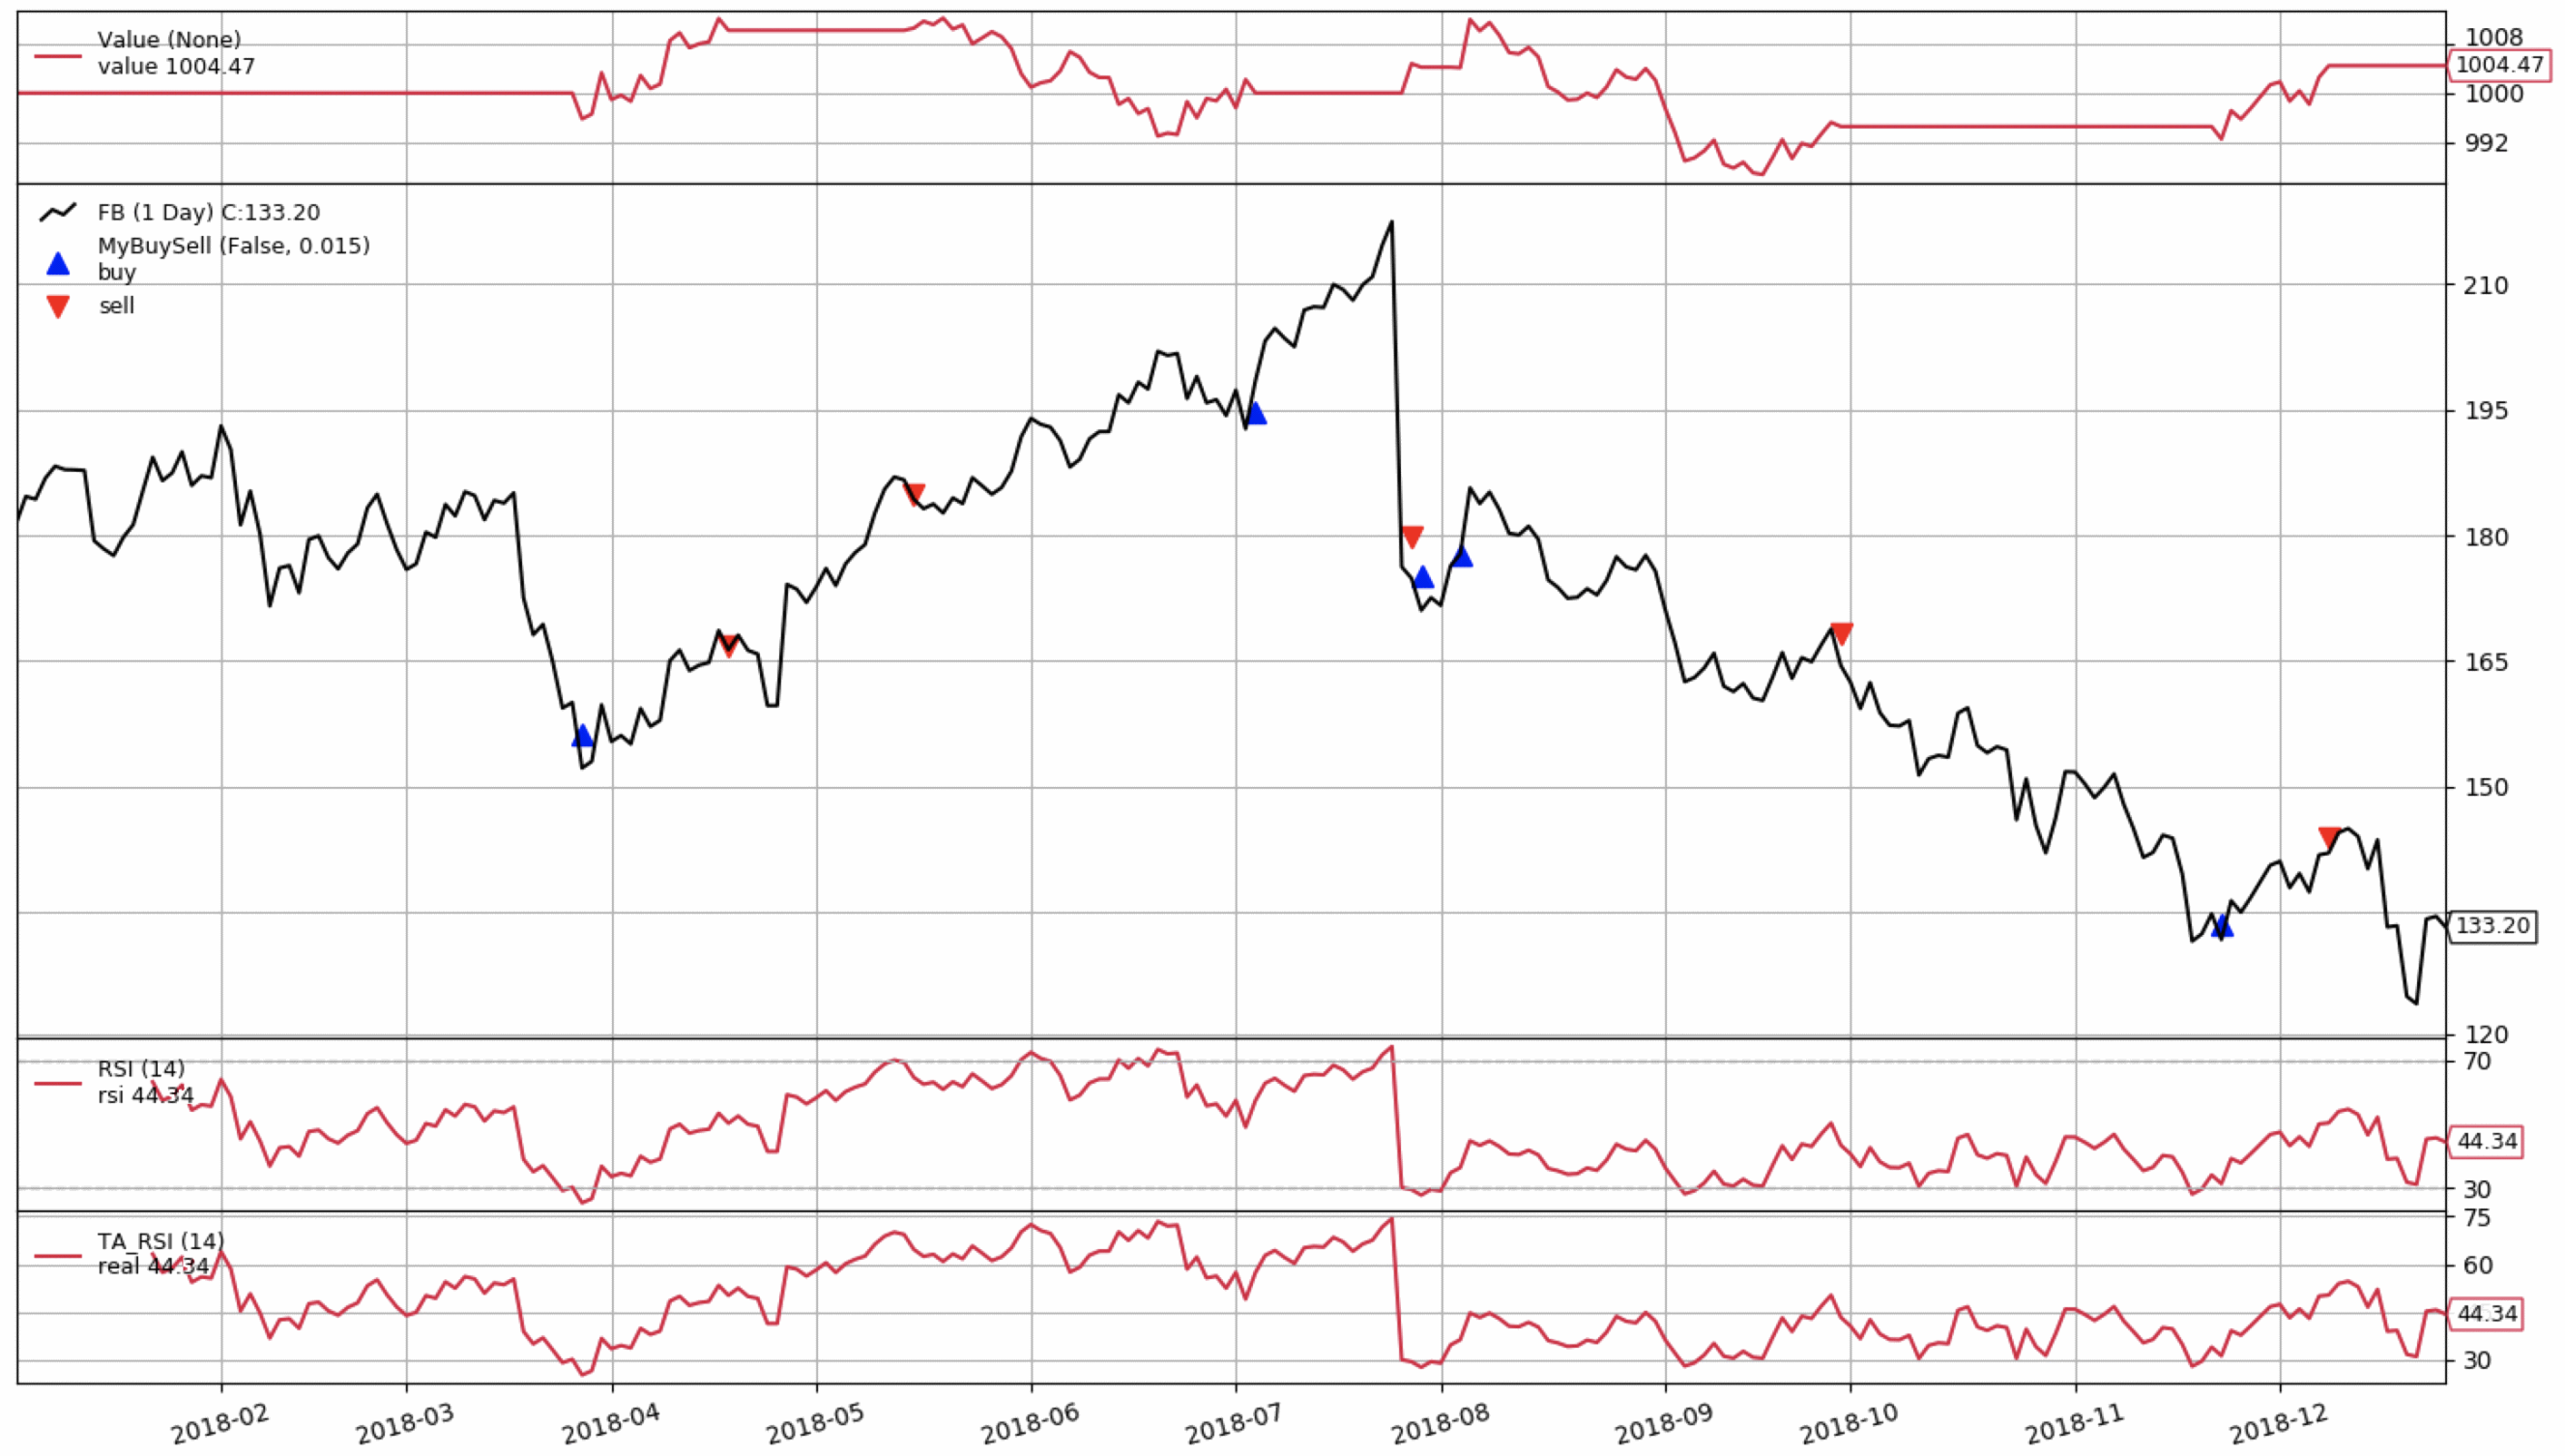
The RSI is an indicator that uses the closing prices of an asset to identify oversold/overbought conditions. Most commonly, the RSI is calculated using a 14-day period, and it is measured on a scale from 0 to 100 (it is an oscillator). Traders usually buy an asset when it is oversold (if the RSI is below 30), and sell when it is overbought (if the RSI is above 70). More extreme high/low levels, such as 80-20, are used less frequently and, at the same time, imply stronger momentum.

In this recipe, we build a trading strategy with the following rules:

  • We can go long and short.
  • For calculating the RSI, we use 14 periods (trading days).
  • Enter a long position if the RSI crosses the lower threshold (standard value of 30) upwards; exit the position when the RSI becomes larger than the middle level (value of 50).
  • Enter a short position if the RSI crosses the upper threshold (standard value of 70) downwards; exit the position when the RSI becomes smaller than 50.
  • Only one position can be open at a time.

We evaluate the strategy on Facebook's stock in 2018, and apply a commission of 0.1%.

How to do it...

Execute the following steps to implement a strategy based on the RSI.

  1. Import the libraries:
from datetime import datetime
import backtrader as bt
  1. Define the signal strategy, based on bt.SignalStrategy:
class RsiSignalStrategy(bt.SignalStrategy):
params = dict(rsi_periods=14, rsi_upper=70,
rsi_lower=30, rsi_mid=50)

def __init__(self):

rsi = bt.indicators.RSI(period=self.p.rsi_periods,
upperband=self.p.rsi_upper,
lowerband=self.p.rsi_lower)

bt.talib.RSI(self.data, plotname='TA_RSI')


rsi_signal_long = bt.ind.CrossUp(rsi, self.p.rsi_lower,
plot=False)
self.signal_add(bt.SIGNAL_LONG, rsi_signal_long)
self.signal_add(bt.SIGNAL_LONGEXIT, -(rsi >
self.p.rsi_mid))

rsi_signal_short = -bt.ind.CrossDown(rsi, self.p.rsi_upper,
plot=False)
self.signal_add(bt.SIGNAL_SHORT, rsi_signal_short)
self.signal_add(bt.SIGNAL_SHORTEXIT, rsi < self.p.rsi_mid)
  1. Download the data:
data = bt.feeds.YahooFinanceData(dataname='FB', 
fromdate=datetime(2018, 1, 1),
todate=datetime(2018, 12, 31))
  1. Set up and run the backtest:
cerebro = bt.Cerebro(stdstats = False)

cerebro.addstrategy(RsiSignalStrategy)
cerebro.adddata(data)
cerebro.broker.setcash(1000.0)
cerebro.broker.setcommission(commission=0.001)
cerebro.addobserver(bt.observers.BuySell)
cerebro.addobserver(bt.observers.Value)

cerebro.run()
  1. Plot the results:
cerebro.plot(iplot=True, volume=False)

Running the code results in the following graph:

We look at the triangles in pairs. The first one indicates opening a position (going long if the triangle is blue and facing up; going short if the triangle is red and facing down). The next triangle (of the opposite color and direction) indicates closing a position. We can match the opening and closing of positions with the RSI below the chart. Sometimes, there are multiple triangles of the same color in sequence. That is because the RSI fluctuates around the line of opening a position, crossing it multiple times, as we can see on the preceding RSI chart. But the actual position is only opened on the first instance of a signal (no accumulation is the default setting).

How it works...

In this recipe, we built a trading strategy on top of bt.SignalStrategy. First, we defined the indicator (RSI), with selected arguments. We also added bt.talib.RSI(self.data,plotname='TA_RSI'), just to show that backtrader provides an easy way to use indicators from the popular TA-Lib library (the TA-Lib library must be installed for the code to work). The trading strategy does not depend on this second indicator; it is only plotted for reference, and we could add an arbitrary number of indicators.

Even when adding indicators for reference only, their existence influences the "warm-up period." For example, if we additionally included a 200-day SMA indicator, no trade would be carried out before there exists at least one value for the SMA indicator.

The next step was to define signals. To do so, we used the bt.CrossUp/bt.CrossDown indicators, which returned 1 if the first series (price) crossed the second (upper or lower RSI threshold) from below/above, respectively. For entering a short position, we made the signal negative, by adding a - in front of the bt.CrossDown indicator.

We can disable printing any indicator, by adding plot=False to the function call.

As the last step of defining the strategy, we added tracking of all the signals, by using the signal_add method. For exiting the positions, the conditions we used (an RSI value higher/lower than 50) resulted in a Boolean, which we had to make negative in case of exiting a long position: -True is the same as -1.

Setting up and running the backtest is analogous to the previous recipe, so please refer to it if in doubt regarding any of the steps.

You have been reading a chapter from
Python for Finance Cookbook
Published in: Jan 2020 Publisher: Packt ISBN-13: 9781789618518
Register for a free Packt account to unlock a world of extra content!
A free Packt account unlocks extra newsletters, articles, discounted offers, and much more. Start advancing your knowledge today.
Unlock this book and the full library FREE for 7 days
Get unlimited access to 7000+ expert-authored eBooks and videos courses covering every tech area you can think of
Renews at $15.99/month. Cancel anytime}