Search icon
Arrow left icon
All Products
Best Sellers
New Releases
Books
Videos
Audiobooks
Learning Hub
Newsletters
Free Learning
Arrow right icon
Python for Finance

You're reading from  Python for Finance

Product type Book
Published in Apr 2014
Publisher
ISBN-13 9781783284375
Pages 408 pages
Edition 1st Edition
Languages
Author (1):
Yuxing Yan Yuxing Yan
Profile icon Yuxing Yan

Table of Contents (20) Chapters

Python for Finance
Credits
About the Author
Acknowledgments
About the Reviewers
www.PacktPub.com
Preface
Introduction and Installation of Python Using Python as an Ordinary Calculator Using Python as a Financial Calculator 13 Lines of Python to Price a Call Option Introduction to Modules Introduction to NumPy and SciPy Visual Finance via Matplotlib Statistical Analysis of Time Series The Black-Scholes-Merton Option Model Python Loops and Implied Volatility Monte Carlo Simulation and Options Volatility Measures and GARCH Index

Chapter 8. Statistical Analysis of Time Series

Understanding the properties of financial time series is very important in finance. In this chapter, we will discuss many issues, such as downloading historical prices, estimating returns, total risk, market risk, correlation among stocks, correlation among different countries' markets from various types of portfolios, and a portfolio variance-covariance matrix; constructing an efficient portfolio and an efficient frontier; estimating Roll (1984) spread; and also estimating the Amihud (2002) illiquidity measure, and Pastor and Stambaugh's (2003) liquidity measure for portfolios. The two related Python modules used are Pandas and statsmodels.

In this chapter, we will cover the following topics:

  • Installation of Pandas and statsmodels

  • Using Pandas and statsmodels

  • Open data sources, and retrieving data from Excel, text, CSV, and MATLAB files, and from a web page

  • Date variable, DataFrame, and merging different datasets by date

  • Term structure of interest...

Installing Pandas and statsmodels


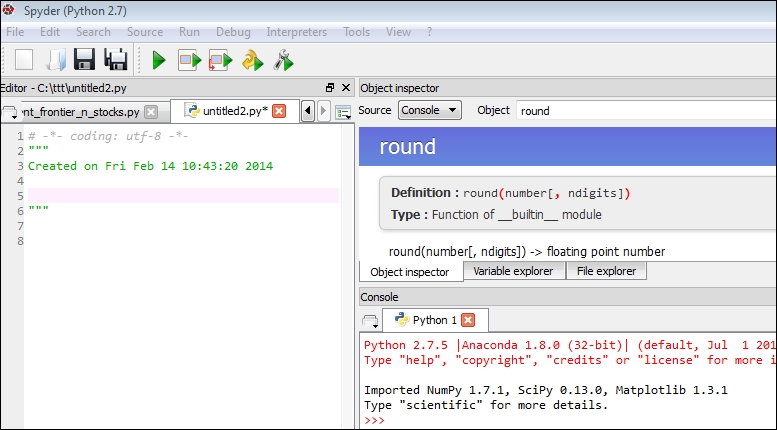
In the previous chapter, we used ActivePython. Although this package includes Pandas using PyPm to install, statsmodel is unavailable in PyPm. Fortunately, we could use Anaconda, introduced in Chapter 4, 13 Lines of Python Code to Price a Call Option. The major reason that we recommend Anaconda is that the package includes NumPy, SciPy, matplotlib, Pandas, and statsmodels. The second reason is its wonderful editor called Spyder.

To install Anaconda, perform the following two steps:

  1. Go to http://continuum.io/downloads.

  2. According to your machine, choose an appropriate package, such as Anaconda-1.8.0-Windows-x86.exe for a Windows version.

There are several ways to launch Python. After clicking on Start | All Programs, search Anaconda; we will see the following hierarchy:

In the following three sections, we show different ways to launch Python.

Launching Python using the Anaconda command prompt

For launching Python using the Anaconda command prompt, perform the following...

Using Pandas and statsmodels


We give a few examples in the following section for the two modules we are going to use intensively in the rest of the book. Again, the Pandas module is for data manipulation and the statsmodels module is for the statistical analysis.

Using Pandas

In the following example, we generate two time series starting from January 1, 2013. The names of those two time series (columns) are A and B:

>>>import numpy as np
>>>import pandas as pd
>>>dates=pd.date_range('20130101',periods=5)
>>>np.random.seed(12345)
>>>x=pd.DataFrame(np.random.rand(5,2),index=dates,columns=('A','B'))

First, we import both NumPy and Pandas modules. The pd.date_range() function is used to generate an index array. The x variable is a Pandas' data frame with dates as its index. Later in this chapter, we will discuss pd.DataFrame(). The columns() function defines the names of those columns. Because the seed() function is used in the program, anyone can generate...

Open data sources


Since this chapter explores the statistical properties of time series, we need certain data. It is a great idea to employ publicly available economic, financial, and accounting data since every reader can download these time series with no cost. The free data sources are summarized in the following table:

Retrieving data to our programs


To feed data to our programs, we need to understand how to input data. Since the data courses vary, we introduce several ways to input data, such as from clipboard, Yahoo! Finance, an external text or CSV file, a web page, and a MATLAB dataset.

Inputting data from the clipboard

In our everyday lives, we use Notepad, Microsoft Word, or Excel to input data. One of the widely used functionalities is copy and paste. The pd.read_clipboard() function contained in Pandas mimics this operation. For example, we type the following contents on Notepad:

x y
1 2 
3 4 
5 6

Then, highlight these entries, right-click on it, copy and paste in the Python console, and run the following two lines:

>>>import pandas as pd
>>>data=pd.read_clipboard()
>>>data
   X  y
1  2
3  4
5  6

This is true for copying data from Microsoft Word and Excel.

Retrieving historical price data from Yahoo! Finance

The following simple program has just five lines, and we can use...

Several important functionalities


Here, we introduce several important functionalities that we are going to use in the rest of the chapters. The Series() function included in the Pandas module would help us to generate time series. When dealing with time series, the most important variable is date. This is why we explain the date variable in more detail. Data.Frame is used intensively in Python and other languages, such as R.

Using pd.Series() to generate one-dimensional time series

We could easily use the pd.Series() function to generate our time series; refer to the following example:

>>>import pandas as pd
>>>x = pd.date_range('1/1/2013', periods=252)
>>>data = pd.Series(randn(len(x)), index=x)
>>>data.head()
2013-01-01    0.776670
2013-01-02    0.128904
2013-01-03   -0.064601
2013-01-04    0.988347
2013-01-05    0.459587
Freq: D, dtype: float64
>>>data.tail()
2013-09-05   -0.167599
2013-09-06    0.530864
2013-09-07    1.378951
2013-09-08   ...

Return estimation


If we have price data, we have to calculate returns. In addition, sometimes we have to convert daily returns to weekly or monthly, or convert monthly returns to quarterly or annual. Thus, understanding how to estimate returns and their conversion is vital. Assume that we have four prices and we choose the first and last three prices as follows:

>>>import numpy as np
>>>p=np.array([1,1.1,0.9,1.05])

It is important how these prices are sorted. If the first price happened before the second price, we know that the first return should be (1.1-1)/1=10%. Next, we learn how to retrieve the first n-1 and the last n-1 records from an n-record array. To list the first n-1 prices, we use p[:-1], while for the last three prices we use p[1:] as shown in the following code:

>>>print(p[:-1])
>>>print(p[1:])
 [ 1.   1.1  0.9]
[ 1.1   0.9   1.05]

To estimate returns, use the following code:

>>>ret=(p[1:]-p[:-1])/p[:-1]
>>>print ret
[...

Merging datasets by date


Assume that we are interested in estimating the market risk (beta) for IBM using daily data. The following is the program we can use to download IBM's price, market return, and risk-free interest rate since we need them to run a capital asset pricing model (CAPM):

from matplotlib.finance import quotes_historical_yahoo
import numpy as np
import pandas as pd
ticker='IBM'
begdate=(2013,10,1)
enddate=(2013,11,9)
x = quotes_historical_yahoo(ticker, begdate, enddate,asobject=True, adjusted=True)
k=x.date
date=[]
for i in range(0,size(x)):
    date.append(''.join([k[i].strftime("%Y"),k[i].strftime("%m"),k[i].strftime("%d")]))
x2=pd.DataFrame(x['aclose'],np.array(date,dtype=int64),columns=[ticker+'_adjClose'])
ff=load('c:/temp/ffDaily.pickle')
final=pd.merge(x2,ff,left_index=True,right_index=True)

A part of the output is given as follows:

In the preceding output, there are two types of data for the five columns: price and returns. The first column is price while the rest...

T-test and F-test


In finance, T-test could be viewed as one of the most used statistical hypothesis tests in which the test statistic follows a student's t distribution if the null hypothesis is supported. We know that the mean for a standard normal distribution is zero. In the following program, we generate 1,000 random numbers from a standard distribution. Then, we conduct two tests: test whether the mean is 0.5, and test whether the mean is zero:

>>>from scipy import stats
>>>np.random.seed(1235)
>>>x = stats.norm.rvs(size=10000)
>>>print("T-value   P-value (two-tail)")
>>>print(stats.ttest_1samp(x,5.0))
>>>print(stats.ttest_1samp(x,0)) 
T-value   P-value (two-tail)
(array(-495.266783341032), 0.0)
(array(-0.26310321925083124), 0.79247644375164772)
>>>

For the first test, in which we test whether the time series has a mean of 0.5, we reject the null hypothesis since the T-value is 495.2 and the P-value is 0. For the second...

Many useful applications


In this section, we discuss many issues, such as the 52-week high and low trading strategy, estimating the Roll (1984) spread, Amihud (2002) illiquidity measure, Pastor and Stambaugh (2003) liquidity measure, and CAPM, and running a Fama-French three-factor model, Fama-Macbeth regression, rolling beta, and VaR.

52-week high and low trading strategy

Some investors/researchers argue that we could adopt a 52-week high and low trading strategy by taking a long position if today's price is close to the minimum price achieved in the past 52 weeks and taking an opposite position if today's price is close to its 52-week high. The following Python program presents this 52-week's range and today's position:

from matplotlib.finance import quotes_historical_yahoo
from datetime import datetime
from dateutil.relativedelta import relativedelta
ticker='IBM'
enddate=datetime.now()
begdate=enddate-relativedelta(years=1)
p = quotes_historical_yahoo(ticker, begdate, enddate,asobject=True...

Constructing an efficient frontier


In finance, constructing an efficient frontier is always a challenging job. This is especially true with real-world data. In this section, we discuss the estimation of a variance-covariance matrix and its optimization, finding an optimal portfolio, and constructing an efficient frontier with stock data downloaded from Yahoo! Finance.

Estimating a variance-covariance matrix

When a return matrix is given, we could estimate its variance-covariance matrix. For a given set of weights, we could further estimate the portfolio variance. The formulae to estimate the variance and standard deviation for returns from a single stock are given as follows:

Here, Ri is the stock return for period i, is their mean, and n is the number of the observations. For an n-stock portfolio, we have the following formulae:

The variance of a two-stock portfolio is given as follows:

Here, is the covariance between stocks 1 and 2, is the correlation coefficient between stocks 1 and 2....

Understanding the interpolation technique


Interpolation is a technique used quite frequently in finance. In the following example, we have to find NaN between 2 and 6. The pd.interpolate() function, for a linear interpolation, is used to fill in the two missing values:

>>>import pandas as pd
>>>import numpy as np
>>>x=pd.Series([1,2,np.nan,np.nan,6])
>>>x.interpolate()
0  1.000000
1  2.000000
2  3.333333
3  4.666667
4  6.000000

If the two known points are represented by the coordinates (x0,y0) and (x1,y1), the linear interpolation is the straight line between these two points. For a value x in the interval of (x0,x1), the value y along the straight line is given by the following formula:

Solving this equation for y, which is the unknown value at x, gives the following result:

From the Yahoo! Finance bond page, we can get the following information:

Name

Web page

Yahoo! Finance

http://finance.yahoo.com

Current and historical pricing, BS, IS, and so on

Google Finance

http://www.google.com/finance

Current and historical trading prices

Federal Reserve Bank Data Library

http://www.federalreserve.gov/releases/h15/data.htm

Interest rates, rates for AAA, AA rated bonds, and so on

Financial statements

Russell indices

http://www.russell.com

Russell indices

Prof. French's Data Library

http://mba.tuck.dartmouth.edu/pages/faculty/ken.french/data_library.html

Fama-French factors, market index, risk-free rate, and industry classification

Census Bureau

http://www.census.gov/

http://www.census.gov/compendia/statab...

Outputting data to external files


In this section, we discuss several ways to save our data, such as saving data or estimating results to a text file, a binary file, and so on.

Outputting data to a text file

The following code will download IBM's daily price historical data and save it to a text file:

>>>from matplotlib.finance import quotes_historical_yahoo
>>>import re
>>>ticker='dell'
>>>outfile=open("c:/temp/dell.txt","w")
>>>begdate=(2013,1,1)
>>>enddate=(2013,11,9)
>>>p = quotes_historical_yahoo(ticker, begdate, enddate,asobject=True, adjusted=True)
>>>x2= re.sub('[\(\)\{\}\.<>a-zA-Z]','', x)
>>>outfile.write(x2)
>>>outfile.close()

Saving our data to a binary file

The following program first generates a simple array that has just three values. We save them to a binary file named tmp.bin at C:\temp\:

>>>import array
>>>import numpy as np
>>>outfile = "c:/temp/tmp.bin...

Python for high-frequency data


High-frequency data is referred to second-by-second or millisecond-by-millisecond transaction and quotation data. The New York Stock Exchange's TAQ (Trade and Quotation) database is a typical example (http://www.nyxdata.com/data-products/daily-taq). The following program can be used to retrieve high-frequency data from Google Finance:

>>>import re, string
>>>import pandas as pd
>>>ticker='AAPL'         # input a ticker
>>>f1="c:/temp/ttt.txt"  # ttt will be replace with aboove sticker
>>>f2=f1.replace("ttt",ticker)
>>>outfile=open(f2,"w")
>>>path="http://www.google.com/finance/getprices?q=ttt&i=300&p=10d&f=d,o,h,l,c,v"
>>>path2=path.replace("ttt",ticker)
>>>df=pd.read_csv(path2,skiprows=8,header=None)
>>>df.to_csv(outfile,header=False,index=False)
>>>outfile.close()

In the preceding program, we have two input variables: ticker and path. After we choose...

More on using Spyder


Since Spyder is a wonderful editor, it deserves more space to explain its usage. The related web page for Spyder is http://pythonhosted.org/spyder/. According to its importance, we go through the most used features. To see several programs we are just recently working on is a very good feature:

  1. Navigate to File | Open Recent. We will see a list of files we recently worked on. Just click on the program you want to work on, and it will be loaded as shown in the following screenshot:

  2. Another feature is to run several lines of program instead of the whole program. Select a few lines, click the second green icon just under Run. This feature makes our programming and debugging task a little bit easier as shown in the following screenshot:

  3. The panel (window) called File explorer helps us to see programs under a certain directory. First, we click on the open icon on the top-right of the screen as shown in the following screenshot:

  4. Then, choose the directory that contains all programs...

A useful dataset


With limited research funding, many teaching schools would not have a CRSP subscription. For them, we have generated a dataset that contains more than 200 stocks, 15 different country indices, Consumer Price Index (CPI), the US national debt, the prime rate, the risk-free rate, Small minus Big (SMB), High minus Low (HML), Russell indices, and gold prices. The frequency of the dataset is monthly. Since the name of each time series is used as an index, we have only two columns: date and value. The value column contains two types of data: price (level) and return. For stocks, CPI, debt-level, gold price, and Russell indices, their values are the price (level), while for prime rate, risk-free rate, SMB, and HML, the second column under value stands for return. The prime reason to have two types of data is that we want to make such a dataset as reliable as possible since any user could verify any number himself/herself. The dataset could be downloaded from http://canisius.edu...

Summary


In this chapter, many concepts and issues associated with statistics are discussed in detail. Topics include how to download historical prices from Yahoo! Finance; estimate returns, total risk, market risk, correlation among stocks, and correlation among different country's markets; form various types of portfolios; estimate a portfolio variance-covariance matrix; construct an efficient portfolio, and an efficient frontier; and estimate the Roll (1984) spread, Amihud's (2002) illiquidity, and Pastor and Stambaugh's (2003) liquidity.

Although in Chapter 4, 13 Lines of Python Code to Price a Call Option, we discuss how to use 13 lines to price a call option based on the Black-Scholes-Merton model even without understanding its underlying theory and logic. In the next chapter, we will explain the option theory and its related applications in more detail.

Exercise


1. What is the usage of the module called Pandas?

2. What is the usage of the module called statsmodels?

3. How can you install Pandas and statsmodels?

4. Which module contains the function called rolling_kurt? How can you use the function?

5. Based on daily data downloaded from Yahoo! Finance, find whether IBM's daily returns follows a normal distribution.

6. Based on daily returns in 2012, are the mean returns for IBM and DELL the same? [Hint: you can use Yahoo! Finance as your source of data].

7. How can you replicate the Jagadeech and Tidman (1993) momentum strategy using Python and CRSP data? [Assume that your school has CRSP subscription].

8. How many events happened in 2012 for IBM based on its daily returns?

9. For the following stock tickers, IBM, DELL, WMT, ^GSPC, C, A, AA, MOFT, estimate their variance-covariance and correlation matrices based on the last five-year monthly returns data, for example, from 2008-2012. Which two stocks are strongly correlated?

10. Write a Python program...

lock icon The rest of the chapter is locked
You have been reading a chapter from
Python for Finance
Published in: Apr 2014 Publisher: ISBN-13: 9781783284375
Register for a free Packt account to unlock a world of extra content!
A free Packt account unlocks extra newsletters, articles, discounted offers, and much more. Start advancing your knowledge today.
Unlock this book and the full library FREE for 7 days
Get unlimited access to 7000+ expert-authored eBooks and videos courses covering every tech area you can think of
Renews at $15.99/month. Cancel anytime}

Maturity

Yield

Yesterday

Last Week

Last Month

3 Month

0.05

0.05

0.04

0.03

6 Month

0.08

0.07

0.07...