


In this chapter, we are going to present a complete cycle for writing validation rules for the Data Flow Model Diagram methodology. I chose this template because there used to be an add-on associated with it in Visio; this add-on is unfortunately no longer provided, and there are no rules for it either.
What are Data Flow Diagrams?
The normal Visio user selects a Visio template from
a category in the Backstage Getting Started view of the Visio user interface.
http://www.agilemodeling.com/artifacts/dataFlowDiagram.htm
Throughout the seventies, various academics developed methodologies for modeling data flows. The one by Gane and Sarson is utilized in the Data Flow Model Diagrams template in Visio. This methodology has the following four elements:
- Squares representing external entities, which are the source or destination of the data. These are the places that provide the organization with data, or have data sent to them by the organization (for example, customers, partners, or government bodies).
- Rounded rectangles representing processes, which take data as input, perform an action with the data, and then produce an output.
- Arrows representing...
You can find the standard Data Flow Model Diagram template in the Software and Databases category:
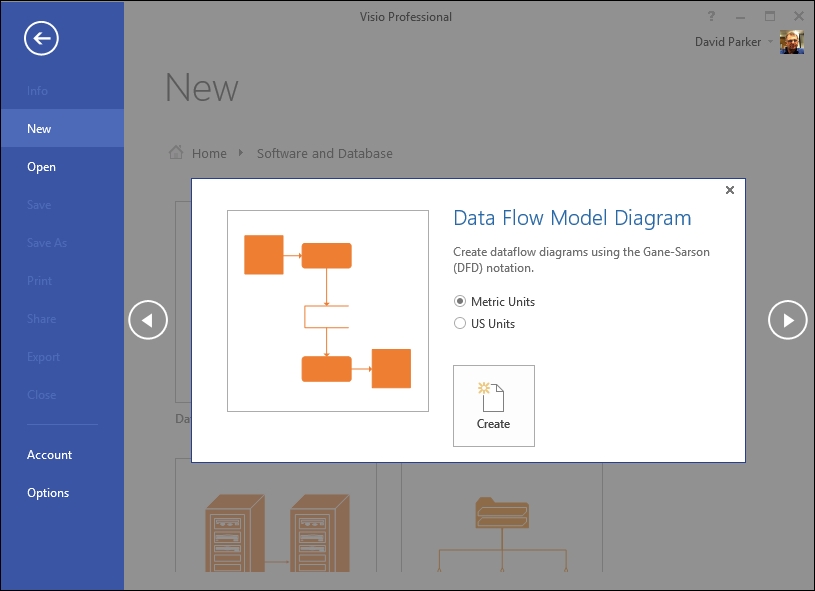
If you create a new document from this template, you will see that there are just four masters on the Gane-Sarson stencil, and there are no rules associated with it at all.

You now need to review the current shapes; one way to do this is to create a quick report in Visio. I started by reviewing the ShapeSheet of each of the shapes, and saw that each of them contains a few User-defined Cells that point to their role within UML diagrams. For example, the User.UMLShapeType cell contains a numerical value that specifies the type of UML shape and the User.visDescription cell contains a text description of this type.
So, you can create a new report that lists all of the shapes on the current page using the Shape Reports button in the Reports...
The rest of the chapter is locked
You have been reading a chapter from
Microsoft Visio 2013 Business Process Diagramming and Validation - Second EditionPublished in: Nov 2013Publisher: PacktISBN-13: 9781782178002
Register for a free Packt account to unlock a world of extra content!
A free Packt account unlocks extra newsletters, articles, discounted offers, and much more. Start advancing your knowledge today.
undefined
Unlock this book and the full library FREE for 7 days
Get unlimited access to 7000+ expert-authored eBooks and videos courses covering every tech area you can think of
Renews at $15.99/month. Cancel anytime