Search icon
Arrow left icon
All Products
Best Sellers
New Releases
Books
Videos
Audiobooks
Learning Hub
Newsletters
Free Learning
Arrow right icon
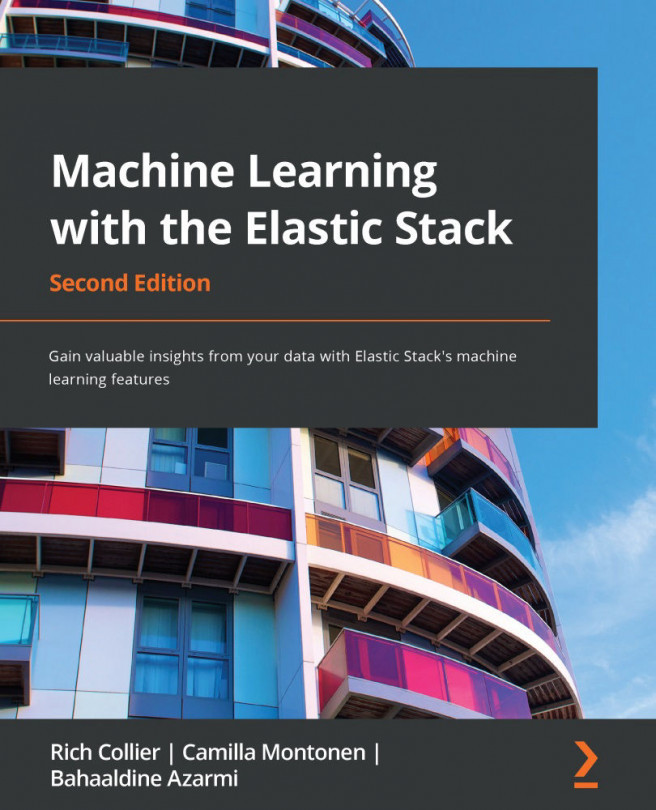
Machine Learning with the Elastic Stack - Second Edition

You're reading from  Machine Learning with the Elastic Stack - Second Edition

Product type Book
Published in May 2021
Publisher Packt
ISBN-13 9781801070034
Pages 450 pages
Edition 2nd Edition
Languages
Authors (3):
Rich Collier Rich Collier
Profile icon Rich Collier
Camilla Montonen Camilla Montonen
Profile icon Camilla Montonen
Bahaaldine Azarmi Bahaaldine Azarmi
Profile icon Bahaaldine Azarmi
View More author details

Table of Contents (19) Chapters

Preface Section 1 – Getting Started with Machine Learning with Elastic Stack
Chapter 1: Machine Learning for IT Chapter 2: Enabling and Operationalization Section 2 – Time Series Analysis – Anomaly Detection and Forecasting
Chapter 3: Anomaly Detection Chapter 4: Forecasting Chapter 5: Interpreting Results Chapter 6: Alerting on ML Analysis Chapter 7: AIOps and Root Cause Analysis Chapter 8: Anomaly Detection in Other Elastic Stack Apps Section 3 – Data Frame Analysis
Chapter 9: Introducing Data Frame Analytics Chapter 10: Outlier Detection Chapter 11: Classification Analysis Chapter 12: Regression Chapter 13: Inference Other Books You May Enjoy Appendix: Anomaly Detection Tips

Chapter 7: AIOps and Root Cause Analysis

Up until this point, we have extensively explained the value of detecting anomalies across metrics and logs separately. This is extremely valuable, of course. In some cases, however, the knowledge that a particular metric or log file has gone awry may not tell the whole story of what is going on. It may, for example, be pointing to a symptom and not the cause of the problem. To have a better understanding of the full scope of an emerging problem, it is often helpful to look holistically at many aspects of a system or situation. This involves smartly analyzing multiple kinds of related datasets together.

In this chapter, we will cover the following topics:

  • Demystifying the term ''AIOps''
  • Understanding the importance and limitations of KPIs
  • Moving beyond KPIs
  • Organizing data for better analysis
  • Leveraging the contextual information
  • Bringing it all together for RCA

Technical requirements

The information and examples demonstrated in this chapter are relevant as of v7.11 of the Elastic Stack and utilize sample datasets from the GitHub repo found at https://github.com/PacktPublishing/Machine-Learning-with-Elastic-Stack-Second-Edition.

Demystifying the term ''AIOps''

We learned in Chapter 1, Machine Learning for IT, that many companies are drowning in an ever-increasing cascade of IT data while simultaneously being asked to ''do more with less'' (fewer people, fewer costs, and so on). Some of that data is collected and/or stored in specialized tools, but some may be collected in general-purpose data platforms such as the Elastic Stack. But the question still remains: what percentage of that data is being paid attention to? By this, we mean the percentage of collected data that is actively inspected by humans or being watched by some type of automated means (defined alarms based on rules, thresholds, and so on). Even generous estimates might put the percentage in the range of single digits. So, with 90% or more data being collected going unwatched, what's being missed? The proper answer might be that we don't actually know.

Before we admonish IT organizations for...

Understanding the importance and limitations of KPIs

Because of the problem of scale and the desire to make some amount of progress in making the collected data actionable, it is natural that some of the first metrics to be tackled for active inspection are those that are the best indicators of performance or operation. The KPIs that an IT organization chooses for measurement, tracking, and flagging can span diverse indicators, including the following:

  • Customer experience: These metrics measure customer experience, such as application response times or error rates.
  • Availability: Metrics such as uptime or Mean Time to Repair (MTTR) are often important to track.
  • Business: Here we may have metrics that directly measure business performance, such as orders per minute or number of active users.

As such, these types of metrics are usually displayed, front and center, on most high-level operational dashboards or on staff reports for employees ranging from technicians...

Moving beyond KPIs

The process of selecting KPIs, in general, should be relatively easy, as it is likely obvious what metrics are the best indicators (if online sales are down, then the application is likely not working). But if we want to get a more holistic view of what may be contributing to an operational problem, we must expand our analysis beyond the KPIs to indicators that emanate from the underlying systems and technology that support the application.

Fortunately, there are a plethora of ways to collect all kinds of data for centralization in the Elastic Stack. The Elastic Agent, for example, is a single, unified agent that you can deploy to hosts or containers to collect data and send it to the Elastic Stack. Behind the scenes, the Elastic Agent runs the Beats shippers or Elastic Endpoint required for your configuration. Starting from version 7.11, the Elastic Agent is managed in Kibana in the Fleet user interface and can be used to add and manage integrations for popular...

Organizing data for better analysis

One of the nicest things about ingesting data via the Elastic Agent is that by default, the data collected is normalized using the Elastic Common Schema (ECS). ECS is an open source specification that defines a common taxonomy and naming conventions across data that is stored in the Elastic Stack. As such, the data becomes easier to manage, analyze, visualize, and correlate across disparate data types – including across both performance metrics and log files.

Even if you are not using the Elastic Agent or other legacy Elastic ingest tools (such as Beats and Logstash) and are instead relying on other, third-party data collection or ingest pipelines, it is still recommended that you conform your data to ECS because it will pay big dividends when users expect to use this data for queries, dashboards, and, of course, ML jobs.

Note

More information on ECS can be found in the reference section of the website at https://www.elastic.co/guide...

Leveraging the contextual information

With our data organized and/or enriched, the two primary ways we can leverage contextual information is via analysis splits and statistical influencers.

Analysis splits

We have already seen that an anomaly detection job can be split based on any categorical field. As such, we can individually model behavior separately for each instance of that field. This could be extremely valuable, especially in a case where each instance needs its own separate model.

Take, for example, the case where we have data for different regions of the world:

Figure 7.7 – Differing data behaviors based on region

Whatever data this is (sales KPIs, utilization metrics, and so on), clearly it has very distinctive patterns that are unique to each region. In this case, it makes sense to split any analysis we do with anomaly detection for each region to capitalize on this uniqueness. We would be able to detect anomalies in the behavior...

Bringing it all together for RCA

We are at the point now where we can now discuss how we can bring everything together. In our desire to increase our effectiveness in IT operations and look more holistically at application health, we now need to operationalize what we've prepared in the prior sections and configure our anomaly detection jobs accordingly. To that end, let's work through a real-life scenario in which Elastic ML helped us get to the root cause of an operational problem.

Outage background

This scenario is loosely based on a real application outage, although the data has been somewhat simplified and sanitized to obfuscate the original customer. The problem was with a retail application that processed gift card transactions. Occasionally, the app would stop working and transactions could not be processed. This would only be discovered when individual stores called headquarters to complain. The root cause of the issue was unknown and couldn't be ascertained...

Summary

Elastic ML can certainly boost the amount of data that IT organizations pay attention to, and thus get more insight and proactive value out of their data. The ability to organize, correlate, and holistically view related anomalies across data types is critical to problem isolation and root cause identification. It reduces application downtime and limits the possibility of problem recurrence.

In the next chapter, we will see how other apps within the Elastic Stack (APM, Security, and Logs) take advantage of Elastic ML to provide an out-of-the-box experience that's custom-tailored for specific use cases.

lock icon The rest of the chapter is locked
You have been reading a chapter from
Machine Learning with the Elastic Stack - Second Edition
Published in: May 2021 Publisher: Packt ISBN-13: 9781801070034
Register for a free Packt account to unlock a world of extra content!
A free Packt account unlocks extra newsletters, articles, discounted offers, and much more. Start advancing your knowledge today.
Unlock this book and the full library FREE for 7 days
Get unlimited access to 7000+ expert-authored eBooks and videos courses covering every tech area you can think of
Renews at $15.99/month. Cancel anytime}