Chapter 6. Jupyter JavaScript Coding
JavaScript is a high-level, dynamic, untyped, and interpreted programming language. There are several outgrowth languages that are based on JavaScript. In the case of Jupyter, the underlying JavaScript is really Node.js. Node.js is an event-based framework that uses JavaScript, which can be used to develop large, scalable applications. Note that this is in contrast to the earlier languages covered in this book which are primarily used for data analysis (Python is a general language as well, but has clear aspects that deal with its capabilities of performing data analysis).
In this chapter, we will cover the following topics:
- Adding JavaScript packages to Jupyter
- JavaScript Jupyter Notebook
- Basic JavaScript in Jupyter
- Node.js
d3 package - Node.js
stats-analysis package - Node.js JSON handling
- Node.js
canvas package - Node.js
plotly package - Node.js asynchronous threads
- Node.js
decision-tree package
Adding JavaScript scripting to your installation
In this section, we will install JavaScript scripting on macOS and Windows. There are separate steps for getting JavaScript scripting available on your Jupyter installation for each environment. The macOS installation is very clean. The Windows installation still appears to be in flux, and I would expect the following instructions to change over time.
Adding JavaScript scripts to Jupyter on macOS or Windows
I followed the instructions for loading the JavaScript engine for Anaconda from https://github.com/n-riesco/iJavaScript. The steps are as follows:
conda install nodejsnpm install -g iJavaScriptijsinstall
At this point, starting Jupyter will provide the JavaScript (Node.js) engine as a choice, as shown in the following screenshot:
JavaScript Hello World Jupyter Notebook
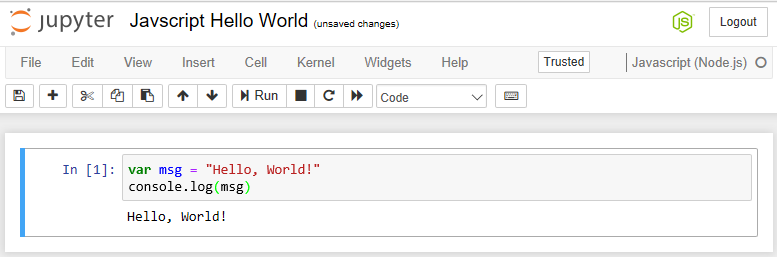
Once installed, we can attempt the first JavaScript Notebook by clicking on the New menu and selecting JavaScript. We will name the NotebookHello, World! and put the following lines in this script:
var msg = "Hello, World!"
console.log(msg)
This script sets a variable and displays the contents of the variable. After entering the script and running (Cell | Run All), we will end up with a Notebook screen that looks like the following screenshot:
We should point out some of the highlights of this page:
- We have the now-familiar language logo in the upper-right corner that depicts the type of script in use
- There is output from every line of the Notebook
- More importantly, we can see the true output of the Notebook (following line one) where the string is echoed
- Otherwise, the Notebook looks as familiar as the other types we have seen
If we look at the contents of the Notebook on disk, we can see similar results as well:
{
  "cells": [
    <<same format...
Basic JavaScript in Jupyter
JavaScript, and even Node.js, are not usually noted for data handling, but for application (website) development. This differentiates JavaScript coding in Jupyter from the languages that we covered earlier. However, the examples in this chapter will highlight using JavaScript for application development with data access and analysis features.
JavaScript limitations in Jupyter
JavaScript was originally used to specifically address the need for scripting inside of an HTML page, usually on the client-side (in a browser). As such, it was built to be able to manipulate HTML elements on the page. Several packages have been developed to further this feature, even for creating a web server, especially using extensions such as Node.js.
The use of any of the HTML manipulation and generation features inside of Jupyter runs into a roadblock, since Jupyter expects to control presentation to the user.
The d3 package has data access functionality. In this case, we will read from a tab-separated file and compute an average. Note the use of the underscore variable name for lodash. Variable names starting with an underscore are assumed to be private. However, in this case, it is just a play on the name of the package we are using, which is lodash, or underscore. lodash is also a widely used a utility package.
For this script to execute, I had to do the following:
- Install
d3 - Install
lodash - Install
isomorphic-fetch (npm install --save isomorphic-fetch es6-promise) - Import
isomorphic-fetch
The script we will use is as follows:
var fs = require("fs");
var d3 = require("d3");
var _ = require("lodash");
var _ = require("isomorphic-fetch");

//read and parse the animals file
console.log("Animal\tWeight");
d3.csv("http://www.dantoomeysoftware.com/data/animals.csv", function(data) {
    console.log(data.name + '\t' + data.avg_weight);
});
This assumes that we have previously loaded the fs...
Node.js stats-analysis package
The stats-analysis package has many of the common statistics that you may want to perform on your data. You will have to install this package using npm, as explained previously.
If we had a small set of people's temperatures to work with, we could get some of the statistics on the data readily by using this script:
const stats = require("stats-analysis");

var arr = [98, 98.6, 98.4, 98.8, 200, 120, 98.5];

//standard deviation
var my_stddev = stats.stdev(arr).toFixed(2);

//mean
var my_mean = stats.mean(arr).toFixed(2);

//median
var my_median = stats.median(arr);

//median absolute deviation
var my_mad = stats.MAD(arr);

// Get the index locations of the outliers in the data set
var my_outliers = stats.indexOfOutliers(arr);

// Remove the outliers
var my_without_outliers = stats.filterOutliers(arr);

//display our stats
console.log("Raw data is ", arr);
console.log("Standard Deviation is ", my_stddev);
console.log("Mean is ", my_mean...
In this example, we will load a JSON dataset and perform some standard manipulations on the data. I am referencing the list of FORD Models from http://www.carqueryapi.com/api/0.3/?callback=?&cmd=getModels&make=ford. I can't reference this directly, as it is not a flat file, but an API call. Therefore, I downloaded the data into a local file called fords.json. Also, the output from the API call wraps the JSON like so: ?(json);. This would have to be removed before parsing.
The scripting we will use is as follows. In the script, JSON is a built-in package of Node.js, so we can reference this package directly. The JSON package provides many of the standard tools that you need to handle your JSON files and objects.
Of interest here is the JSON file reader, which constructs a standard JavaScript array of objects. Attributes of each object can be referenced by name, for example, model.model_name:
//load the JSON dataset
//http://www.carqueryapi.com/api/0.3/?callback...
The canvas package is used for generating graphics in Node.js. We can use the example from the canvas package home page (https://www.npmjs.com/package/canvas).
First, we need to install canvas and its dependencies. There are directions on the home page for the different operating systems, but it is very familiar to the tools we have seen before (we have seen them for macOS):
npm install canvasbrew install pkg-config cairo libpng jpeg giflib
Note
This example does not work in Windows. The Windows install required Microsoft Visual C++ to be installed. I tried several iterations to no avail.
With the canvas package installed on your machine, we can use a small Node.js script to create a graphic:
// create a canvas 200 by 200 pixels
var Canvas = require('canvas')
  , Image = Canvas.Image
  , canvas = new Canvas(200, 200)
  , ctx = canvas.getContext('2d')
  , string = "Jupyter!";

// place our string on the canvas
ctx.font = '30px Impact';
ctx.rotate(.1);
ctx.fillText...
plotly is a package that works differently to most. To use this software, you must register with a username so that you are provided with an api_key (at https://plot.ly/). You then place the username and api_key in your script. At that point, you can use all of the plotly package features.
First, like all of the other packages, we need to install it:
npm install plotly
Once installed, we can reference the plotly package as needed. Using a simple script, we can generate a histogram with plotly:
//set random seed
var seedrandom = require('seedrandom');
var rng = seedrandom('Jupyter');
//setup plotly
var plotly = require('plotly')(username="<username>", api_key="<key>")
var x = [];
for (var i = 0; i < 500; i ++) {
    x[i] = Math.random();
}
require('plotly')(username, api_key);
var data = [
  {
    x: x,
    type: "histogram"
  }
];
var graphOptions = {filename: "basic-histogram", fileopt: "overwrite"};
plotly.plot(data, graphOptions, function...
Node.js asynchronous threads
Node.js has built-in mechanisms for creating threads and having them fire asynchronously. Using an example from http://book.mixu.net/node/ch7.html, we have the following:
//thread function - invoked for every number in items array
function async(arg, callback) {
  console.log('cube \''+arg+'\', and return 2 seconds later');
  setTimeout(function() { callback(arg * 3); }, 2000);
}

//function called once - after all threads complete
function final() { console.log('Done', results); }

//list of numbers to operate upon
var items = [ 0, 1, 1, 2, 3, 5, 7, 11 ];

//results of each step
var results = [];

//loop the drives the whole process
items.forEach(function(item) {
  async(item, function(result){
    results.push(result);
    if(results.length == items.length) {
      final();
    }
  })
});
This script creates an asynchronous function that operates on a number. For every number (item), we call upon the inline function, passing the number...
Node.js decision-tree package
The decision-tree package is an example of a machine learning package. It is available at https://www.npmjs.com/package/decision-tree. The package is installed by using the following command:
npm install decision-tree
We need a dataset to use for training/developing our decision tree. I am using the car MPG dataset from the following web page: https://alliance.seas.upenn.edu/~cis520/wiki/index.php?n=Lectures.DecisionTrees. It did not seem to be available directly, so I copied it into Excel and saved it as a local CSV.
The logic for machine learning is very similar:
- Load our dataset
- Split into a training set and a testing set
- Use the training set to develop our model
- Test the mode on the test set
Note
Typically, you might use two-thirds of your data for training and one-third for testing.
Using the decision-tree package and the car-mpgdataset, we would have a script similar to the following:
//Import the modules
var DecisionTree = require('decision-tree');
var fs = require...
In this chapter, we learned how to add JavaScript to our Jupyter Notebook. We saw some of the limitations of using JavaScript in Jupyter. We had a look at examples of several packages that are typical of Node.js coding, including d3 for graphics, stats-analysis for statistics, built-in JSON handling, canvas for creating graphics files, and plotly, which is used for generating graphics with a third-party tool. We also saw how multi-threaded applications can be developed using Node.js under Jupyter. Lastly, we saw machine learning for developing a decision tree.
In the next chapter, we will see how to create interactive widgets that can be used in your Notebook.