Chapter 5. Transforming Data
Transforming data in Alteryx can ensure that the dataset best fits the needs of how the output data should be analyzed. In this chapter, you'll learn the pivot orientations of the Transpose and Crosstab tools and how they help to guide the pathway to a visual representation of your data. Once your data has been aligned to meet business needs, you will dive into summarizing and aggregating your data to perform various numeric and string actions.
This chapter will cover the following topics:
- Transforming data
- Summarizing and aggregating data
- Running total
- Weighted average
The way we see data and visualize trends begins with the data structure. The data structure is key when creating data visualizations. Knowing how it's structured and why it's structured in a specific orientation leads to a smoother workflow build and design that turns into a successful output table to create brilliant data visualizations. We'll cover two tools that transform data in this section: the Transpose tool and the Crosstab tool.
The Transpose tool will pivot a wide dataset to a narrow dataset. This is the tall and skinny dataset that will put the fields in rows, and the values in rows as well. More rows will be created when data is transposed to a narrower dataset. This is great for trying to get one field that contains all the field names and the values associated with those field names alongside each other in rows. A calculation can be referenced on one field, rather than an individual calculation referencing each field if they were in their own columns. Transposing...
Summarizing and aggregating data
Summary calculations and aggregating data at various levels using group by functions are available through the Summarize tool. This is a popular tool that performs a variety of summation calculations, including: summing, math, min/max, string concatenation, grouping, and much more.
We will go through seven various calculations using the summary tool, and why these calculations are beneficial. Let's begin by looking through these examples using the same workflow as the previous section.
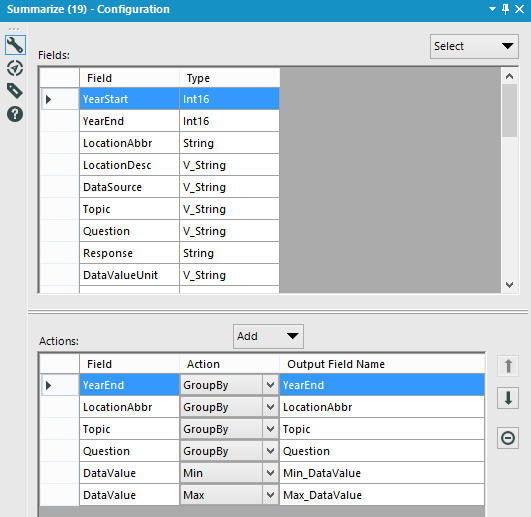
Summarize Example #1: Find the Min and Max DataValue by YearEnd, LocationAbbr, Topic, and Question.
Step 1: Select the Summarize tool from the Transform tool palette and drag it onto the canvas. Connect the Auto Field tool to the Summarize tool.
Step 2: Select the following fields and select Add from the dropdown to select their respective actions:
Step 3: Add a Browse tool to the Summarize tool.
Step 4: Run the workflow.
Notice that in the Browse tool, the min and max data values...
A running total is a great way of obtaining a cumulative sum per record. The Running Total tool can be used to create a running total, and like the Summarize tool, there are Group By options available to include if you want to group the data by the available fields. Running Totals are useful for getting a total for a group; in this case, a running total of DataValueAlt by YearEnd and Topic. The cumulative sum will be continuing to aggregate until a new YearEnd and Topic appears in the data set. Once this occurs, the running total will start the cumulative sum again. Let's look at how to apply running totals using the same workflow from the previous section.
Running Total Example #1: Find the running total for DataValueAlt by YearEnd and Topic.
Step 1: Select the Running Total tool from the Transform tool palette and drag it onto the canvas. Connect the Auto Field tool to the Running Total tool.
Step 2: Select the following fields under the Group By (Optional) selections: YearEnd...
The contribution amount to a set of values is defined as weighting, where some records are configured to contribute more than others. The Weighted Average tool located within the Transform tool palette contains questions that will help identify how the weighting should be computed. Let's look at an example of using the Weighted Average tool using the same workflow as the previous section.
Weighted Average Example #1: Find the running total for DataValueAlt by YearEnd and Topic.
Step 1: Select the Weighted Average tool from the Transform tool palette and drag it onto the canvas. Connect the Auto Field tool to the Weighted Average tool.
Step 2: Select the following field under the Value Field (Numeric) dropdown: DataValueAlt.
Step 3: Select the following field under the Weight Field (Numeric) dropdown: HighConfidenceLimit.
Step 4: Leave the Output Field Name as is, WeightedAverage.
The snapshot for the Weighted Average Configuration is as follows:
Step 5: Add a Browse tool to the...
The ideal way to structure your data depends on how the result is defined. You may notice within a workflow that data needs to be transformed in a certain way, and the two ways this can be done are by using the Transpose tool to unpivot data, changing data from a wide dataset to a narrow dataset, and by using the Crosstab tool to pivot data, changing data from a narrow dataset to wider dataset. In this chapter, we reviewed many aggregation types available within the Summarize tool. The granularity of data can be defined within the Group By actions and the aggregation types are an action selection away to achieve the desired result. The Running Total is a great option for obtaining a cumulative sum of your data up to a certain point, defined by the Group By options, and the Weighted Average is used for applying a contribution amount for more records than others. This tool also contains the Group By option, specifying how data needs to be grouped together. These tools, available within...