Reader small image

You're reading from  Kibana 7 Quick Start Guide

Product typeBook
Published inJan 2019
PublisherPackt
ISBN-139781789804034
Edition1st Edition
Tools
Right arrow
Author (1)
Anurag Srivastava
Anurag Srivastava
author image
Anurag Srivastava

Anurag Srivastava is a senior technical lead in a multinational software company. He has more than 12 years' experience in web-based application development. He is proficient in designing architecture for scalable and highly available applications. He has handled development teams and multiple clients from all over the globe over the past 10 years of his professional career. He has significant experience with the Elastic Stack (Elasticsearch, Logstash, and Kibana) for creating dashboards using system metrics data, log data, application data, and relational databases. He has authored three other booksMastering Kibana 6.x, and Kibana 7 Quick Start Guide, and Learning Kibana 7 - Second Edition, all published by Packt.
Read more about Anurag Srivastava

Right arrow

Visualizing Data

In earlier chapters, we covered how to install different components of the Elastic Stack, and then configured Beats and Logstash to push data into Elasticsearch. After pushing the data into Elasticsearch, we covered Kibana Discover to explore data by applying query and filter on the data, and after that saved the search data for further use. So, basically, we have set the stage by creating the index pattern to create Elasticsearch index data availability in Kibana. Now, we are going to discuss the most important features of Kibana, using which we can create meaningful visualizations with the data.

There are different types of visualizations we can create using Kibana, such as basic charts under which we can create an area, heat map, horizontal bar, line, pie, vertical bar, and so on. Then under data category of visualization, we have data table, gauge, goal, and...

Data visualization

In the previous chapter, we covered Kibana Discover, using which we can explore our data to understand it better. Using Discover, we can do lots of things, but when it comes to showing your complete data in a single view, we need a visualization. So, when we talk about data visualization, we mean a process to display data in the form of graphical charts, bars, maps, or any sort of visual representation. Data visualization provides us a way to understand more about the data, such as what is the trend, anomalies in data, or the pattern of the data quite easily.

Data aggregation

Now, if we talk about Kibana Visualize, it uses Elasticsearch aggregation for creating visualizations. So, basically, in the background...

Inspecting visualizations

We can inspect a visualization to see the actual data behind the graphical visualization. We can also see the statistics, such as the number of total hits, index pattern, query time, request time, and so on, or the actual request JSON of Elasticsearch and the actual response JSON of Elasticsearch. We can also download the formatted or raw CSV data from the inspect screen. The following screenshot shows us the data view of Inspect:

The preceding screenshot shows the inspect view of the data for the apache_response_codes area chart we created earlier. In this view, we can see the tabular data display's response code and total requests. From this data view screen, we can download the raw or pre-formatted CSV data. We can change this data view to the requests view by changing it through the View dropdown in the top-right corner of the page. After changing...

Sharing a visualization

Once the visualization is created, we can embed it on any web page using the share option of the visualization. To share a visualization, we need to click on the share button on the top-right corner of the page. This opens the share this visualization popup with two options: Embed code and Permalinks. The Embed code option is present, using which we can copy the iframe code to integrate it into any web page. There are two different options under embed code: the first is Snapshot, using which we can save the current state of the visualization, and no change on current visualization after we create the snapshot. Another option is Saved Object, which shows the most recent saved version of the visualization, and if we do an update in the visualization it will be reflected in the shared version. We have a short URL option, using which we can create a short URL...

Dashboard

Up to now, we have covered how to create different types of visualizations in Kibana; now, let's see how we can integrate different types of visualizations to create a dashboard. Dashboards are quite useful as they provide us a single view to monitor the KPI. To create a dashboard in Kibana, we need to do following:

  1. Click on the dashboard link from the left menu, which will open the dashboards page with a list of existing dashboards.
  2. We can click on any existing dashboard to open the dashboard. But as we want to create a new one, click on the Create a new dashboard button in the top-right corner of the page.
  3. This will open a blank page with the message This dashboard is empty. Let's fill it up!.
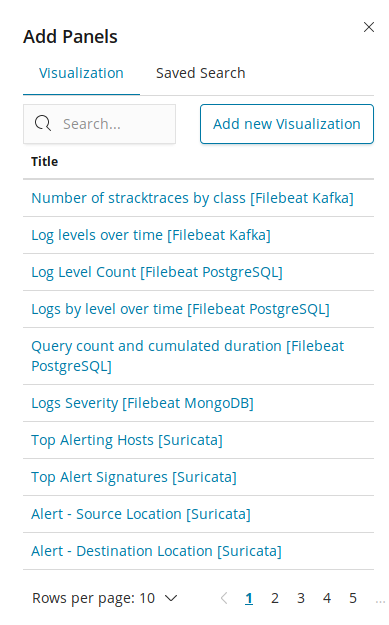
  4. Click on the Add button to add the visualizations. This will open the following screen of Add Panels:

In the preceding screen, we have the visualization and saved...

Summary

In this chapter, we covered how to visualize the data once it is available in Kibana, after creating the index pattern. We started with basic charts, where we covered creating chart such as the area chart, heat map, and pie charts, and so on. We also covered how we can transform one type of chart into another by giving examples of an area chart, line chart, and bar chart; in the same way, we can change a pie chart into a donut, or vice versa. After that, we have covered data tables, using which we can generate a tabular visualization of data, to which we can add additional metrics columns, along with actual data columns. Then, we covered the metric type of visualization, where we can display some metric value, and tag cloud, which can be used to display a word cloud with a link to filter the data.

We covered dashboard creation by integrating visualizations and arranging...

lock icon
The rest of the chapter is locked
You have been reading a chapter from
Kibana 7 Quick Start Guide
Published in: Jan 2019Publisher: PacktISBN-13: 9781789804034
Register for a free Packt account to unlock a world of extra content!
A free Packt account unlocks extra newsletters, articles, discounted offers, and much more. Start advancing your knowledge today.
undefined
Unlock this book and the full library FREE for 7 days
Get unlimited access to 7000+ expert-authored eBooks and videos courses covering every tech area you can think of
Renews at $15.99/month. Cancel anytime

Author (1)

author image
Anurag Srivastava

Anurag Srivastava is a senior technical lead in a multinational software company. He has more than 12 years' experience in web-based application development. He is proficient in designing architecture for scalable and highly available applications. He has handled development teams and multiple clients from all over the globe over the past 10 years of his professional career. He has significant experience with the Elastic Stack (Elasticsearch, Logstash, and Kibana) for creating dashboards using system metrics data, log data, application data, and relational databases. He has authored three other booksMastering Kibana 6.x, and Kibana 7 Quick Start Guide, and Learning Kibana 7 - Second Edition, all published by Packt.
Read more about Anurag Srivastava